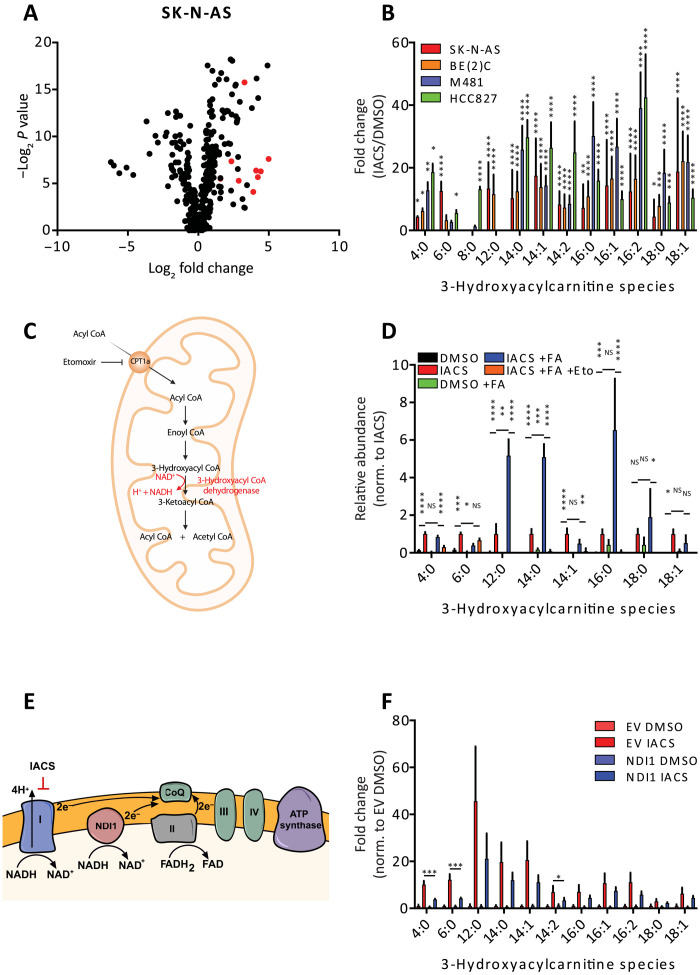
Fig. 2. Metabolic effects of IACS-010759.
(A) Untargeted metabolomics analysis projected as relative abundances in IACS-010759-treated versus DMSO-treated SK-N-AS xenografts (DMSO, n = 7; IACS-010759, n = 7). The 3-hydroxyacylcarnitines are indicated by red dots. (B) Relative abundance of 3-hydroxyacylcarnitines in four xenograft lines expressed as fold change between IACS-010759 and DMSO treatment (SK-N-AS: DMSO, n = 7 and IACS-010759, n = 7; BE(2)C: DMSO, n = 7 and IACS-010759, n = 7; M481: DMSO, n = 5 and IACS-010759, n = 5; HCC827: DMSO, n = 4 and IACS-010759, n = 4). (C) Schematic depicting the steps of β oxidation, including the 3-hydroxyacyl–CoA dehydrogenase–mediated conversion of 3-hydroxyacyl–CoA to 3-ketoacyl–CoA. (D) Relative abundance of 3-hydroxyacylcarnitines following treatment for 72 hours with 1 μM IACS-010759, 100 μM palmitate (+FA), and 5 μM etomoxir. Metabolite abundances are normalized to IACS-010759 treatment without palmitate. (E) Schematic showing the site of action of IACS-010759 and how NDI1 can be used to rescue complex I inhibition. (F) Relative abundance of 3-hydroxyacylcarnitines following NDI1 expression (EV: DMSO, n = 5 and IACS-010759, n = 6; NDI1: DMSO, n = 6 and IACS-010759, n = 5). Statistical significance was assessed using log2-transformed one-way ANOVA followed by Sidak’s multiple comparisons adjustment (B, D, and F), Kruskal-Wallis test followed by Dunn’s multiple comparisons adjustment (B and D), or log2-transformed Welch’s one-way ANOVA followed by Dunnett’s T3 method for multiple comparisons adjustment (B and F). Statistical tests were two-sided. Data represent means ± SD. *P = 0.01 to 0.05, **P = 0.001 to 0.01, ***P = 0.0001 to 0.001, and ****P < 0.0001.

