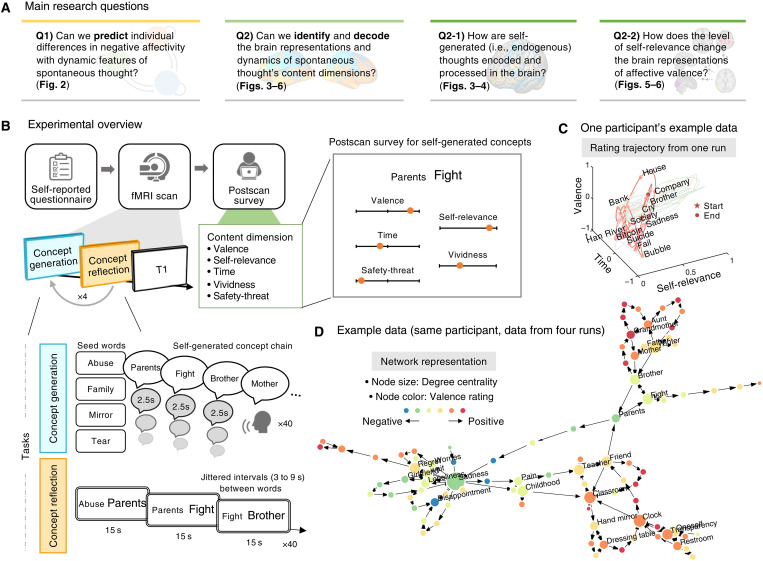
Fig. 1. Research questions and experimental overview.
(A) Main research questions and their corresponding result figures. (B) An experimental overview. Participants completed a battery of self-report questionnaires before the fMRI scans. During the fMRI scans, participants underwent the FAST, which consisted of three main parts—concept generation, concept reflection, and postscan survey. The fMRI experiment had four runs, each of which included the concept generation and concept reflection tasks. For the concept generation task, we asked participants to report a word or phrase that came to their mind in response to the previous concept every 2.5 s starting from a given seed word. The seed words for the first session included family, tear, mirror, and abuse. After participants generated 40 concept-chain responses, we showed the two consecutive responses and asked them to think about the target (i.e.., the second) concept’s personal meaning for 15 s. After the scan, we asked participants to complete a postscan survey on the 160 self-generated concepts. We showed the two consecutive concepts again and asked participants to rate the target concept in terms of their valence, self-relevance, time, vividness, and safety-threat. (C) One participant’s example data are shown on the three-dimensional space of valence, self-relevance, and time. The dots indicate self-generated responses, and the pink line indicates data from one run. A red star indicates the start of the run, and the red dot indicates the ending point. (D) A network representation of one participant’s data. The dots represent the self-generated responses, and the arrows show the direction of the concept generation. The dot colors represent the averaged valence scores of each concept, and the dot size indicates the degree centrality (i.e., how many edges are connected to the node).

