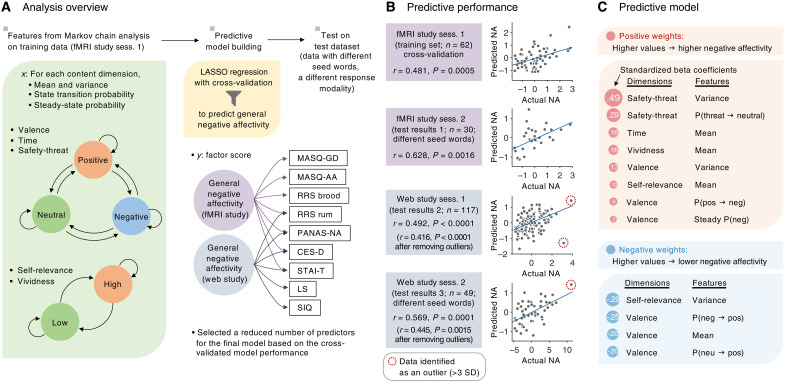
Fig. 2. Markov chain–based predictive modeling of negative affectivity.
(A) Analysis overview. The input features for the predictive modeling included the state transition and steady-state probabilities estimated with the Markov chain analysis and the mean and variance of the content dimension ratings. With these features, we developed predictive models of general negative affectivity, which we modeled with factor analyses. Although the actual factor models also included self-report questionnaires for a factor of general positive affectivity, here, we show the questionnaires only for the general negative affectivity factor for brevity. We used a LASSO regression as a fitting algorithm. For details about the analysis and questionnaires, please see Materials and Methods. (B) Model performance. From top to bottom, the plots show (i) the leave-one-participant-out cross-validated prediction results within the training dataset (n = 62, first session of the fMRI study) and three independent test results on (ii) the second session retest data of the fMRI study with different seed words (n = 30), (iii) the first session data of the FAST web study (n = 117), and (iv) the second session retest data of the FAST web study with different seed words (n = 49). The actual versus predicted negative affectivity factor scores are shown in the plots. Each dot represents each participant. We evaluated the model performance with a robust correlation. After removing outliers identified with three SDs, the prediction-outcome correlation remained significant. NA, negative affectivity. (C) To interpret the final model, we examined the standardized beta coefficients of the input features of the model. From the LASSO regression, a total of 12 features were selected. The features in red indicate positive weights, whereas the features in blue indicate negative weights.

