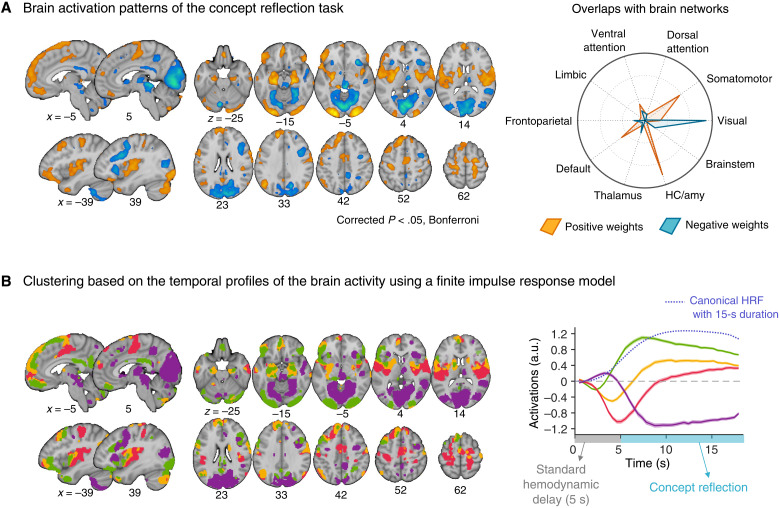
Fig. 3. Brain activation patterns during the concept reflection task.
(A) The basic contrast map for concept reflection versus baseline thresholded at P < 0.05 with Bonferroni correction. The radial plot shows the relative proportions of overlapping voxels between the thresholded map and large-scale networks (or regions), given the total number of voxels within each network (or each region). For the definitions of large-scale networks and regions, see fig. S6. HC, hippocampus. (B) To better understand the temporal patterns of brain activity during concept reflection, we conducted a clustering analysis based on a finite impulse response (FIR) model. We identified four clusters, and the plot on the right shows the time-course of averaged activity across voxels of each cluster. Shading represents the SEM. On the x axis, zero represents the onset of the trial, and the gray area represents the standard hemodynamic delay, which peaks at around 5 s. The blue dotted line shows the canonical hemodynamic response function (HRF) for an event with a 15-s duration. a.u., arbitrary units.

