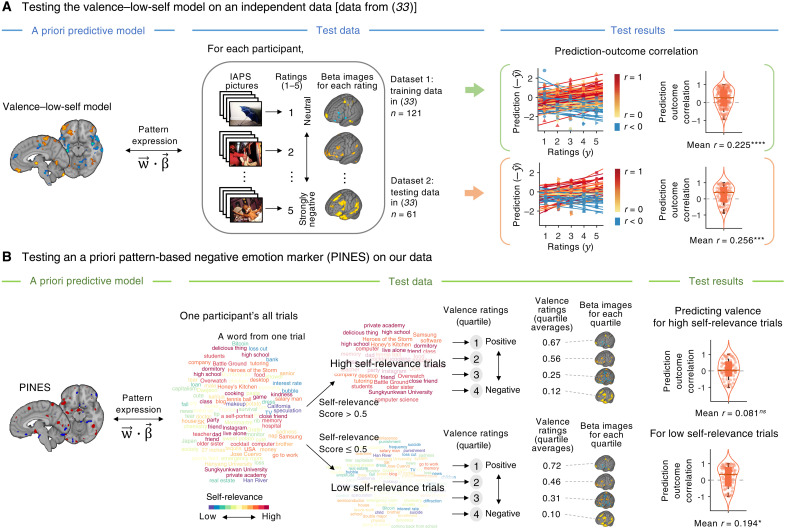
Fig. 5. Cross-testing of two a priori models of valence on two independent datasets.
(A) To further validate our valence–low-self model, we tested the model on an independent study dataset, in which negative emotions were induced using the IAPS pictures (33). To this end, we applied the valence–low-self model to the beta images from the two independent datasets corresponding to five-point negative emotion ratings ranging from 1 (neutral) to 5 (strongly negative). We obtained predicted ratings by calculating a dot product of each vectorized test image data with the model weights. The plot on the right shows the actual versus predicted ratings. For convenience, we added the negative sign to the predicted ratings to make the expected prediction into positive correlations. Each colored line in the plot represents an individual participant’s data (red, higher r; yellow, lower r; blue, r < 0). The violin and box plots display the distributions of within-participant prediction-outcome correlations. ***P < 0.001 and ****P < 0.0001, bootstrap tests, two-tailed. (B) To test whether the level of self-relevance modulated the brain representation of valence, we tested an a priori neuroimaging emotion marker, PINES (33) on our data, separately for trials with high self-relevance scores (>0.5) versus low self-relevance scores (≤0.5). First, we divided one individual’s high and low self-relevance trials into valence quartiles. Then, we averaged beta images and valence ratings within each quartile to use as test data. We found pattern expression values with a dot product between the PINES weights and the test data of high and low self-relevant trials. Thus, the model performance was based on the quartile data based on the valence scores, and the violin and box plots on the right show the distributions of within-participant prediction-outcome correlations. ns, not significant; *P < 0.05, bootstrap tests, two-tailed.

