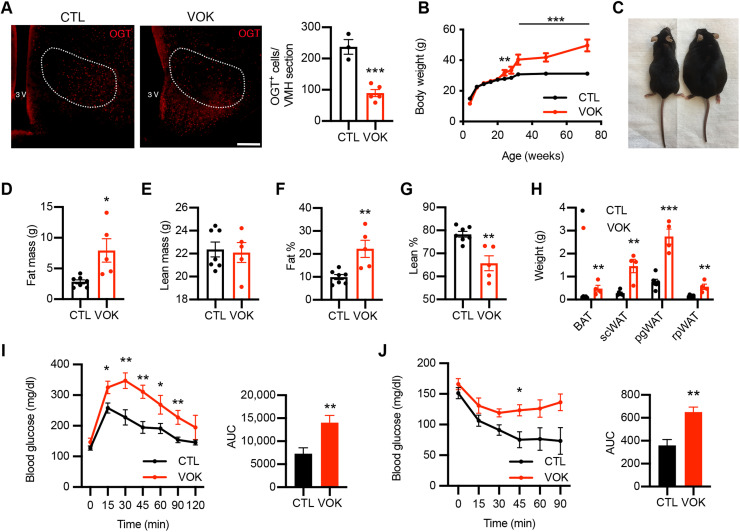
Fig. 2. Chronic deletion of OGT in SF1 neurons leads to obesity in mice fed a normal chow diet.
(A) Immunostaining of OGT in the VMH of CTL and VOK mice. Quantifications of OGT-positive cells in the VMH are shown on the right. Scale bar, 200 μm. (B) Body weight monitoring of male CTL and VOK mice fed a normal chow diet. (C) Representative image of CTL and VOK mice at 18 months of age. (D) Fat mass of male CTL and VOK mice at 6 months of age. (E) Lean mass of male CTL and VOK mice at 6 months of age. (F) Percentage of fat mass to body weight of male CTL and VOK mice at 6 months of age. (G) Percentage of lean mass to body weight of male CTL and VOK mice at 6 months of age. (H) Weight of different adipose tissues of male CTL and VOK mice at 18 months of age. (I) Glucose tolerance test of male CTL and VOK at 18 months of age. (J) Insulin tolerance test of male CTL and VOK mice at 18 months of age. CTL: n = 6 to 10; VOK: n = 4 to 8. Data are shown as means ± SEM. *P < 0.05, **P < 0.01, and ***P < 0.001 by unpaired Student’s t test. AUC, area under the curve.

