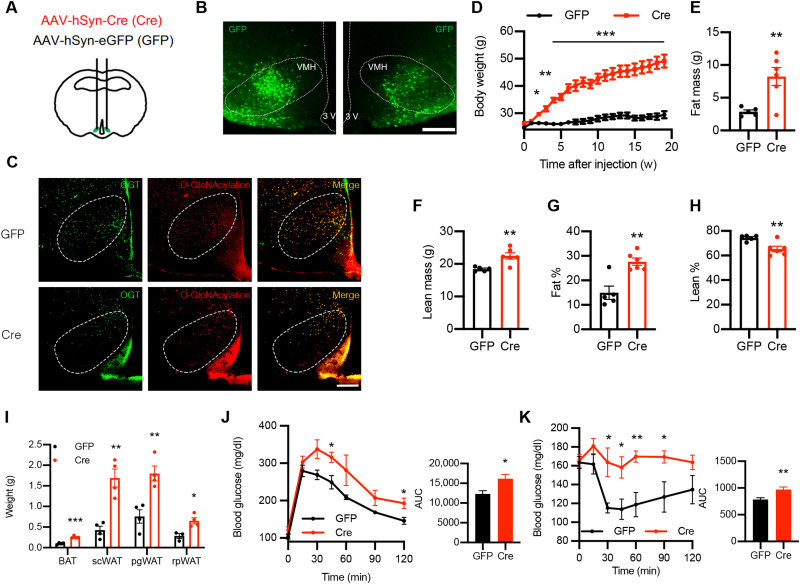
Fig. 5. Acute deletion of OGT in VMH neurons leads to obesity in mice fed a normal chow diet.
(A) Schematic showing the generation of control (GFP) and VMH neuron-specific OGT knockout (Cre) mice by stereotaxically injecting AAV-GFP or AAV-Cre bilaterally into the VMH of male Ogtflox mice at 12 weeks of age. (B) Confirmation of the AAV injection coordinate. Scale bar, 200 μm. (C) Validation of OGT deletion and reduction of O-GlcNAcylation level in the VMH of Cre mice. Scale bar, 200 μm. OGT was imaged using Alexa Fluor 647 with the green pseudo-color. (D) Body weight monitoring of GFP and Cre mice fed a normal chow diet. (E) Fat mass of GFP and Cre mice 4 weeks after stereotaxic virus injection. (F) Lean mass of GFP and Cre mice 4 weeks after stereotaxic virus injection. (G) Percentage of fat mass to body weight of GFP and Cre mice 4 weeks after stereotaxic virus injection. (H) Percentage of lean mass to body weight of GFP and Cre mice 4 weeks after stereotaxic virus injection. (I) Weight of different adipose tissues of GFP and Cre mice 32 weeks after stereotaxic virus injection. (J) Glucose tolerance test of GFP and Cre mice 5 weeks after stereotaxic virus injection. (K) Insulin tolerance test of GFP and Cre mice 6 weeks after stereotaxic virus injection. GFP: n = 8 and Cre: n = 8 for body weight monitoring. GFP: n = 4 and Cre: n = 4 for body composition measurements, weights of adipose tissues, glucose, and insulin tolerance test. Data are shown as means ± SEM. *P < 0.05, **P < 0.01, and ***P < 0.001 by unpaired Student’s t test.

