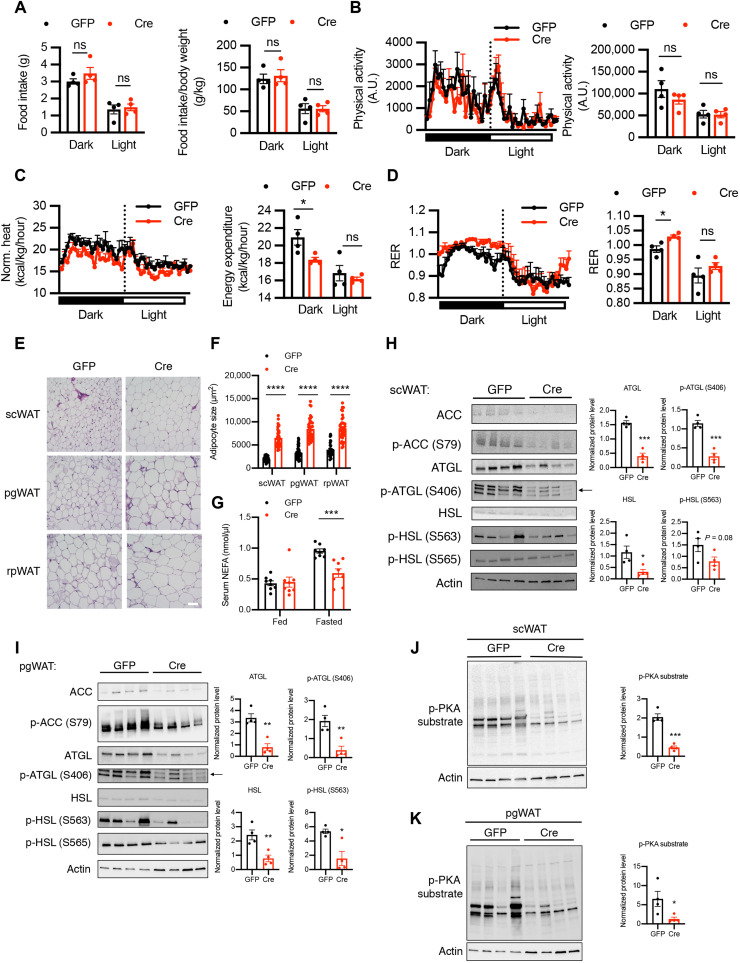
Fig. 6. Mice with acute deletion of OGT in VMH neurons show reduced energy expenditure and adipocyte hypertrophy associated with reduced lipolysis of white adipose tissues.
(A to D) Metabolic cage analysis of food intake (A), physical activity (B), energy expenditure (C), and RER (D) of GFP and Cre mice 2 weeks after stereotaxic virus injection before body weight divergence. (E) H&E staining of scWAT, pgWAT, and rpWAT of CTL and VOK mice after 6 hours of fasting. Scale bar, 100 μm. (F) Adipocyte sizes in different white adipose tissues of CTL and VOK mice. Individual dots represent individual adipocytes from three GFP and four Cre mice. (G) Serum nonesterified fatty acid (NEFA) levels of GFP and Cre mice fed ad libitum and after 15 hours of fasting. (H and I) Western blot of acetyl-CoA carboxylase (ACC), p-ACC (S79), ATGL, p-ATGL (S406), HSL, p-HSL (S563), and p-HSL (S565) in scWAT (H) and pgWAT (I) of GFP and Cre mice after 6 hours of fasting. Densitometric quantifications for the expression levels of ATGL, p-ATGL (S406), HSL, and p-HSL (S563) are shown on the right. (J and K) Western blot of p-PKA substrate in scWAT (J) and pgWAT (K) of GFP and Cre mice after 6 hours of fasting. Densitometric quantification is shown below. GFP: n = 4 and Cre: n = 4 for metabolic cage analysis. GFP: n = 8 to 10 and Cre: n = 8 to 10 for serum NEFA. Data are shown as means ± SEM. *P < 0.05, **P < 0.01, ***P < 0.001, and ****P < 0.0001 by unpaired Student’s t test. A.U., arbitrary units.

