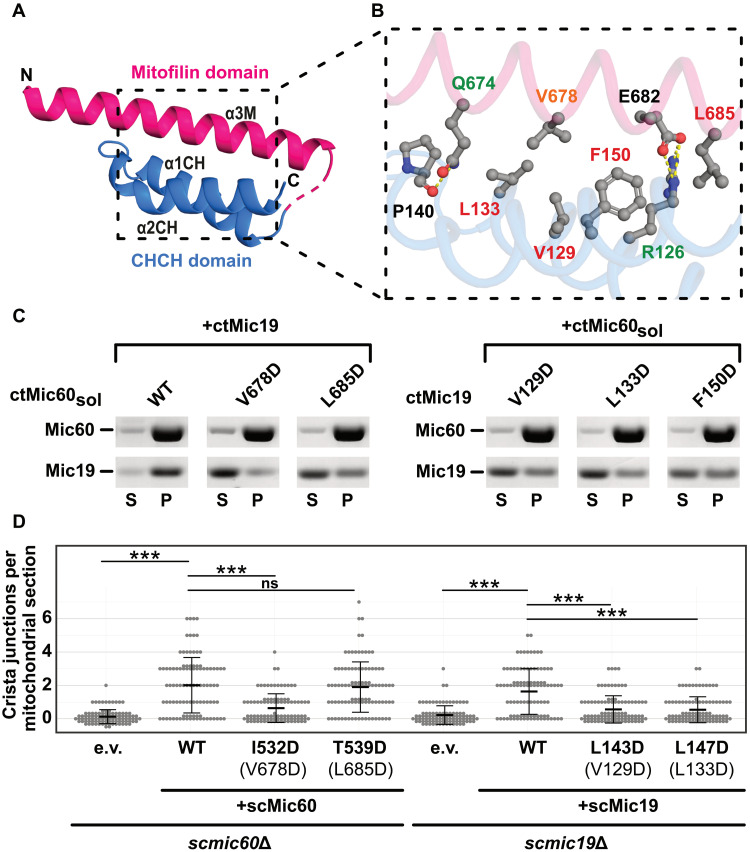
Fig. 3. Structural characterization of the Mic60 and Mic19 interaction.
(A) Structure of Mito1_CHCH fusion construct. Domains are colored as in Fig. 2A. The unresolved linker region is indicated as dashed line. (B) Magnification of the ctMic60-ctMic19 interface. Label colors represent the effect of single amino acid substitutions, as analyzed by ITC experiments: Green, up to 15× reduced; orange, up to 100× reduced; red, no binding, compared to the ctMic60sol-ctMic19 interaction. See fig. S5 for ITC data. (C) Liposome cosedimentation assays of ctMic60sol and ctMic19. S, supernatant; P, pellet. See also fig. S2 (C and D). (D) Quantification of CJs per mitochondrial section in S. cerevisiae mitochondria. ***P ≤ 0.001. ns, not significant. See also fig. S6B. Numbering of the corresponding ctMic60 residues is shown in parentheses.

