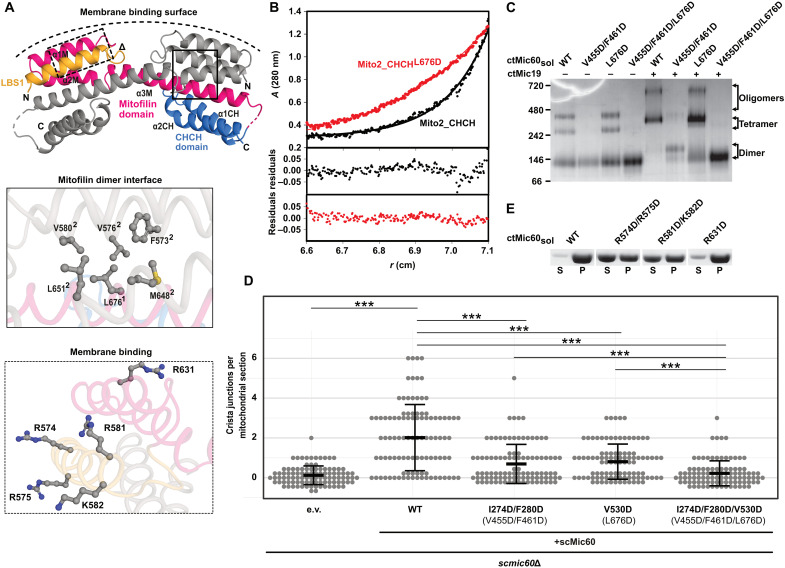
Fig. 4. The mitofilin dimer forms a convex membrane-binding site.
(A) Cartoon representation of the mitofilin dimer in complex with the Mic19 CHCH domain (Mito2_CHCH). One monomer is colored as in Fig. 2A. Dimer interface residues (boxed in straight lines) and potential membrane binding residues (boxed in dashed lines) are shown in the close-up views. The deduced curved membrane binding surface is indicated. (B) Association states of Mito2_CHCH (black) and Mito2_CHCHL676D (red) were analyzed at a concentration of 1 mg/ml by sedimentation equilibrium analysis. Top: The original data (dots) and the fit of the data (line): Mito2_CHCH: molecular mass (Mr) = 34 ± 4 kDa. Mito2_CHCHL676D: Mr = 16 ± 2 kDa (molecular weight of the monomer: 17 kDa). Bottom: The deviation of the fit to the data. (C) BN-PAGE analysis of different ctMic60sol variants and their complexes with ctMic19. (D) Quantification of CJs per mitochondrial section in S. cerevisiae mitochondria. ***P ≤ 0.001. See also see fig. S6B. Numbering of the corresponding C. thermophilum residues is shown in parentheses. (E) Liposome cosedimentation assays of ctMic60sol and membrane binding variants (see also fig. S2C).

