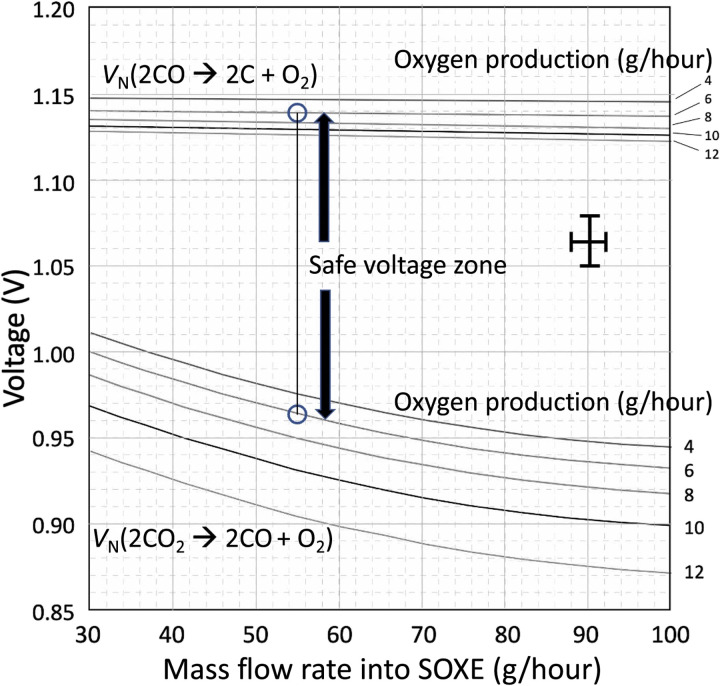
Fig. 3. Nernst potentials for oxygen and carbon formation versus input mass flow for several rates of oxygen production at an operating temperature of 800°C.
The two circles and the vertical line show reference segment conditions of 55 g/hour of intake and 6 g/hour of oxygen production. The dark arrows show the safe voltage zone for oxygen production, with no coking under these conditions. The vertical error bar reflects the effect of uncertainty in the lead resistance (see in the “Diagnostic runs” section) on the voltage applied to the cells. The horizontal error bar shows the uncertainty in determining the mass flow rate.

