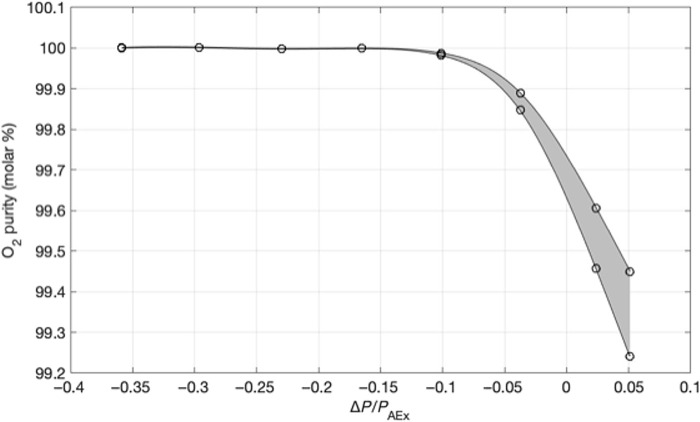
Fig. 4. Measured oxygen purity as a function of the nominal pressure difference between cathode and anode, normalized by the anode pressure (FM OC13).
The x axis is determined by the measured differential exhaust pressure, which is smaller than the actual SOXE pressure. The gray area represents the range between the best fit to the composition data (higher purity) and a more physically reasonable model (lower purity). Note that other MOXIE runs were operated at even higher values of ΔP/PAEx but were not part of this focused diagnostic.

