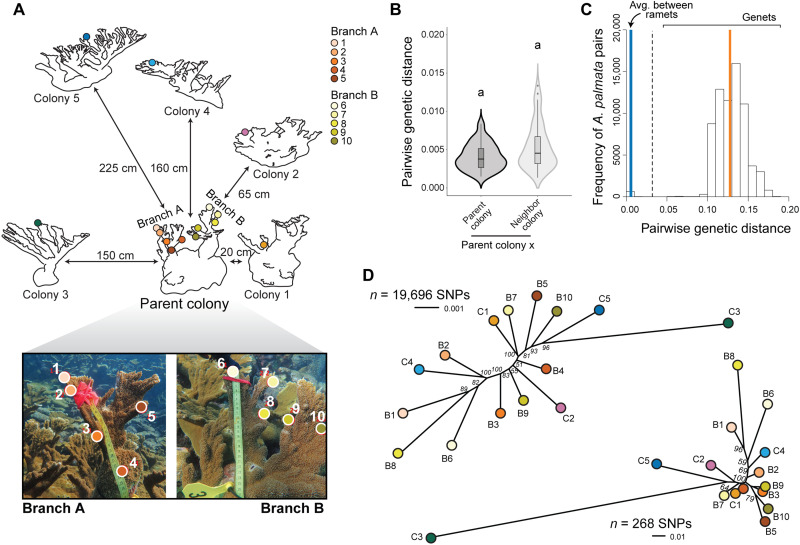
Fig. 1. Detection and mapping of somatic mutations across a parent coral colony and five nearest neighbor colonies (ramets) from the same coral genet.
(A) Sampling map of the parent colony and its five nearest neighbor colonies. Colonies are arranged according to their location on the reef with linear distances between colonies indicated next to the arrows. Colored circles indicate the locations of the tissue samples that were genotyped. Individual colonies in the line drawing are enlarged to show detail and not drawn to scale. Photo credit: Kate L. Vasquez Kuntz, The Pennsylvania State University. (B) Plot of Prevosti’s pairwise genetic distance within the parent colony and between the parent colony and the five neighboring colonies. All genetic distances were smaller than the distance threshold for genet assignment; therefore, all six colonies belonged to the same coral genet. (C) Histogram showing the frequency of pairwise genetic distances for 263 A. palmata samples collected from across the Caribbean in a previous study. The genet threshold is 0.032 (dashed black line). Average genetic distance was 0.0057 ± 0.0054 among ramets of the same genet (blue line, n = 148 ramets from 34 genets). Average genetic distance was 0.128 ± 0.025 among genets that fall above the genet threshold (orange line) [modified with permission from Kitchen et al. (26)]. (D) Neighbor-joining trees for all samples taken from the parent colony (B1 to B10) and nearest neighbor colonies (C1 to C5) showing all loci analyzed (upper tree, n = 19,696) and only those loci identified as mutations (lower tree, n = 268). Nodal values represent support from 100 bootstrap replicates.

