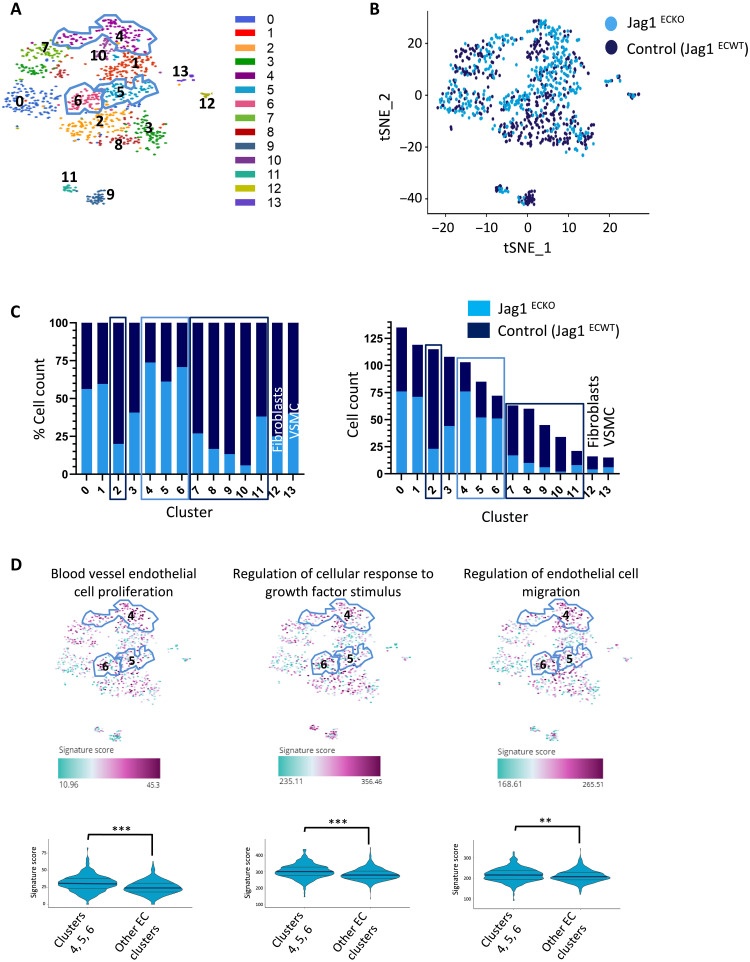
Fig. 5. scRNA-seq analysis of Jag1-regulated endothelial heterogeneity.
Aortas from Jag1ECKO and control mice were analyzed by FACS of CD31+ CD45− cells coupled to scRNA-seq. (A) t-SNE representation of single-cell transcriptomes from Jag1ECKO and control mice colored by cluster assignment. Clusters were identified using unbiased hierarchical clustering. (B) t-SNE showing the cell contribution of Jag1ECKO and control mice to each subpopulation. (C) Bar graph showing the cell distribution of Jag1ECKO and control mice across cell clusters, by percentage (left) and number of cells (right). Clusters 4 to 6 are largely composed of ECs derived from Jag1ECKO mice, whereas cluster 2 and 7 to 11 are mainly composed of ECs derived from control mice. (D) Representation of enriched GO pathways on the t-SNE map. An overall score summarizing the expression of genes in each GO pathway is calculated for every cell in the scRNA-seq dataset. Differences between means were calculated using a Wilcoxon signed-rank test.

