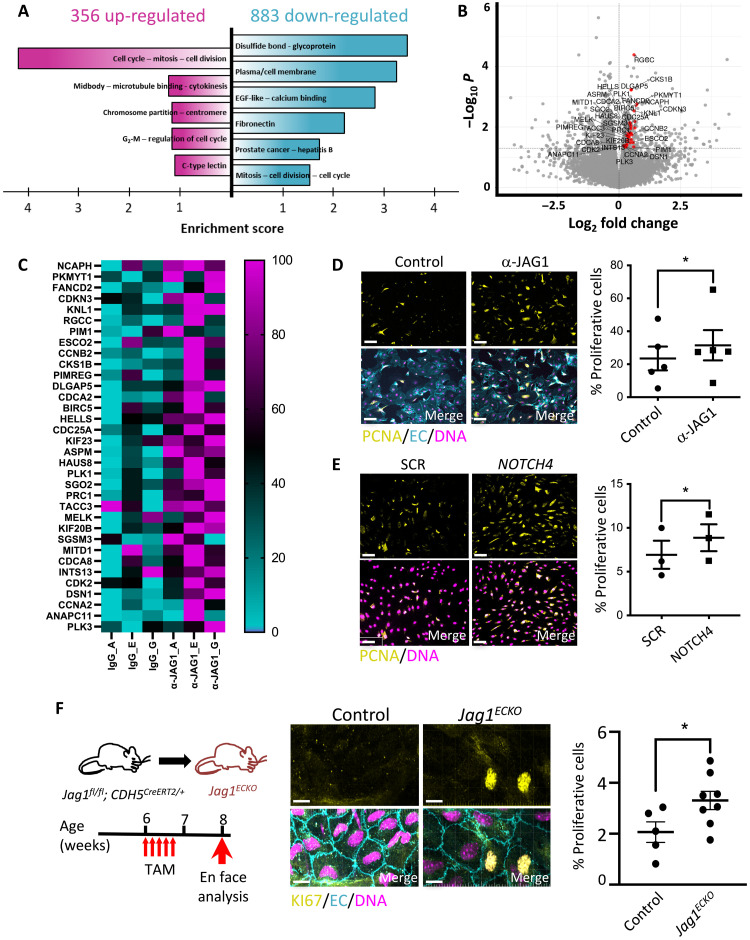
Fig. 6. JAG1 activation by LOSS leads to inhibition of endothelial repair.
(A to C) HCAECs were exposed to LOSS and treated with α-JAG1 blocking antibody or control isotype-matched antibodies for 48 hours before bulk RNA-seq. (A) Functional annotation clustering of the genes up-regulated (in magenta) and down-regulated (in cyan) in response to α-JAG1 (P < 0.05) using DAVID. Clusters with the highest enrichment score are shown. EGF, epidermal growth factor. (B) Genes associated with cell cycle are up-regulated following blockade with α-JAG1. Volcano plot displaying differentially expressed genes between JAG1 blockade and control samples. The y axis is the mean expression value of −log10 (P value), and the x axis displays the log2 fold change value. Significantly differentially expressed genes with a functional enrichment for the cell cycle are labeled and highlighted in red. (C) Heatmap showing the expression of proliferation-associated genes. Gene expression levels were normalized so that the highest expression is set to 100% and the lowest expression to 0 (n = 3). HCAECs were treated with α-JAG1 blocking antibody or control isotype-matched antibodies (n = 5) (D) or were treated with NOTCH4 siRNA or with scrambled nontargeting sequences (SCR; n = 3) (E). Cultures were exposed to LOSS for 72 hours, and proliferation was quantified by immunofluorescence staining using antibodies against proliferating cell nuclear antigen (PCNA) (yellow). Differences between means were analyzed using paired t tests. Scale bars, 50 μm. (F) EC proliferation at an LOSS region of the aorta (inner curvature of arch) was quantified in control (n = 5) versus Jag1ECKO (n = 8) mice 2 weeks after tamoxifen injection by en face immunostaining using antibodies against Ki67 (yellow). Endothelium was costained (anti-CDH5; EC; cyan), and nuclei were detected using 4′,6-diamidino-2-phenylindole (DNA; magenta). Representative images are shown. The proportion of proliferative Ki67-positive cells (center) and the average total cell count per field of view (right) were calculated. Differences between means were analyzed using unpaired t test. Scale bars, 10 μm.

