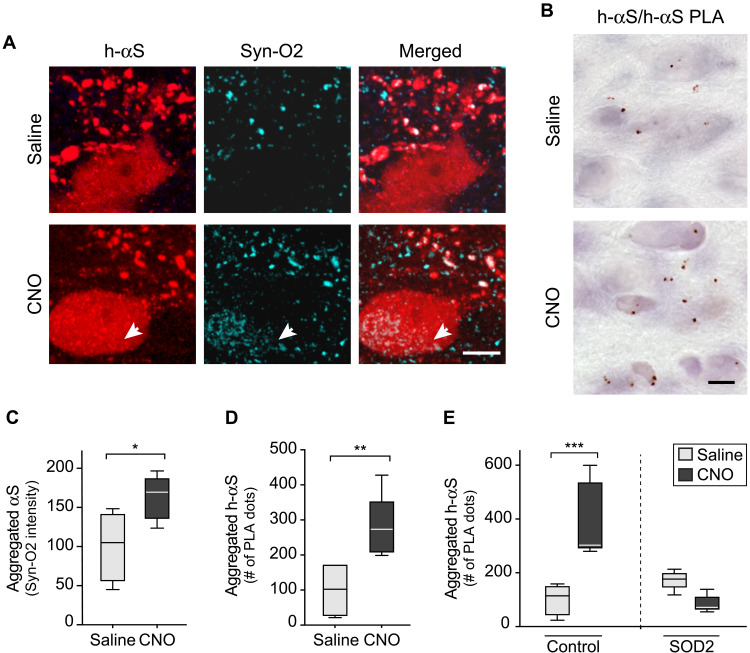
Fig. 10. SOD2 overexpression prevents hyperactivity-induced h-αS aggregation.
(A and B) Mice received an injection of a solution containing Cre- and hM3Dfl-AAVs into the left vagus nerve. They were then divided into two groups and treated with saline or CNO. Medullary sections from mice treated with saline (n = 4) or CNO (n = 5) were double-stained with anti–h-αS and Syn-O2, an antibody recognizing aggregated αS forms. Images show neurites and cell bodies in the left DMnX; the arrow indicates a cell body colabeled for h-αS and Syn-O2. Scale bar, 10 μm (A). Sections of the MO from mice treated with saline (n = 5) or CNO (n = 5) were processed for h-αS/h-αS PLA. Images show PLA dots in the left DMnX. Scale bar, 20 μm (B). (C) Analysis of sections stained with anti–h-αS and Syn-O2. Syn-O2 fluorescent intensity was measured within h-αS–positive DMnX neurons; an average of 30 neurons per animal was analyzed. Cell intensity values were averaged for each animal, and data were calculated as percentage of the mean value in the saline-injected group. (D) Analysis of sections processed for h-αS/h-αS PLA. For each mouse, the number of PLA dots was counted in the left DMnX; data were calculated as percentage of the mean value in the corresponding saline group (D). (E) Mice were coinjected with Cre-, hM3Dfl-, and empty-AAVs (control mice) or Cre-, hM3Dfl-, and SOD2-AAVs (SOD2 animals). Animals were also treated with saline or CNO. Sections of the MO from control/saline (n = 5), control/CNO (n = 5), SOD2/saline (n = 5), and SOD2/CNO (n = 5) mice were processed for h-αS/h-αS PLA. The number of PLA dots was counted in the left DMnX; data were calculated as percentage of the mean value in the corresponding saline-injected group. Plots show median, upper and lower quartiles, and maximum and minimum as whiskers. *P < 0.05, **P < 0.01, and ***P < 0.001.

