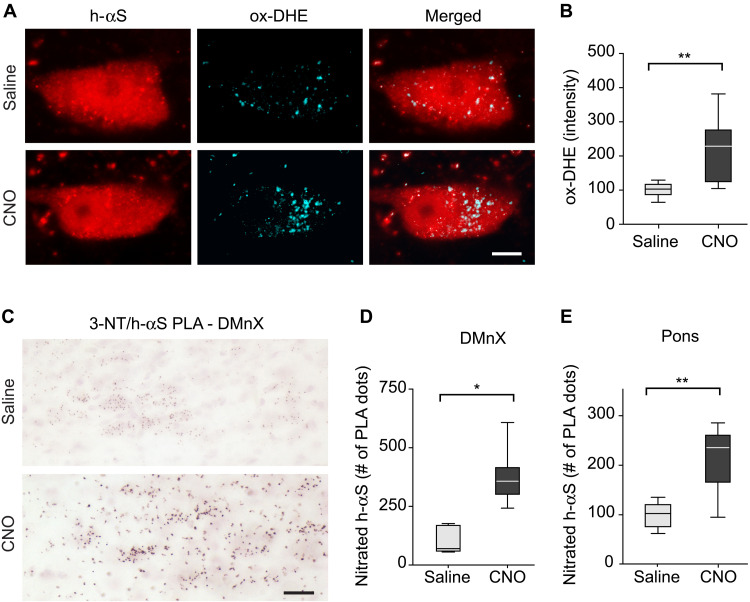
Fig. 4. Neuronal hyperactivity induces oxidant and nitrative stress.
(A and B) iR26-αS mice were coinjected with Cre- and hM3Dfl-AAVs and treated with daily injections of either saline (n = 8) or CNO (n = 7) during weeks 4 and 5 after AAV injection. At the end of week 5, they received an injection of DHE 1 hour before sacrifice. Sections of the MO were immunostained with anti–h-αS. Representative confocal images show fluorescent puncta of ox-DHE within h-αS–positive DMnX neurons. Scale bar, 10 μm (A). Ox-DHE fluorescent intensity was measured within h-αS–positive DMnX neurons (approximately 30 neurons per animal). For each animal, neuronal intensity values were averaged; the averaged value was then calculated as percentage of the mean value in the saline group (B). (C to E) Mice injected with Cre- and hM3Dfl-AAVs also received either saline (n = 6) or CNO (n = 7). To detect nitrated h-αS, sections of the MO and pons were processed for 3-NT/h-αS PLA. Representative images show specific chromogenic PLA dots in the left (injected side) DMnX. Scale bars, 50 μm (C). For each animal, the number of PLA dots was estimated in the left DMnX using unbiased stereology; data were calculated as percentage of the mean value in the saline group (D). The number of PLA dots was counted in left pontine sections; for each mouse, counts were done on a single section corresponding to bregma −5.34 mm, and data were calculated as percentage of the mean value in the saline group (E). Box and whisker plots show median, upper and lower quartiles, and maximum and minimum as whiskers. *P < 0.05 and **P < 0.01.

