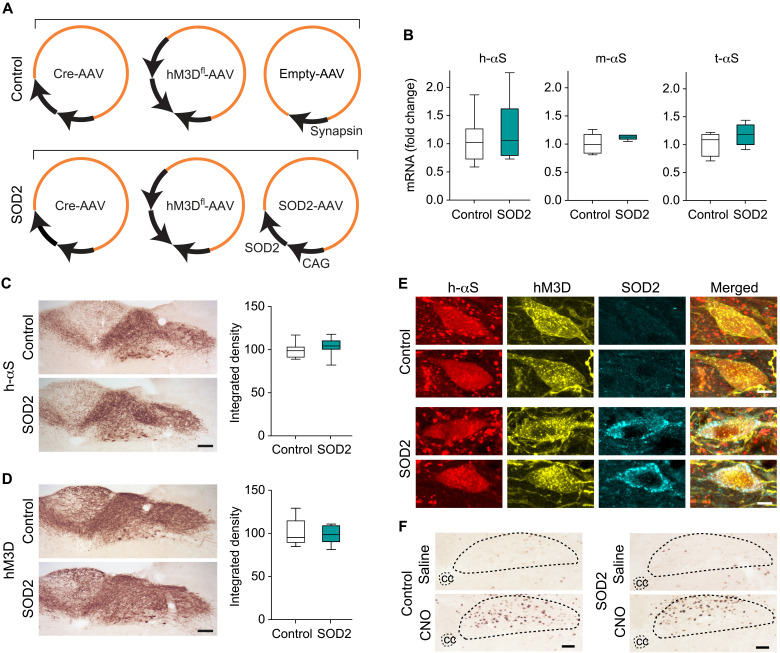
Fig. 8. H-αS, hM3D, and SOD2 are coexpressed after AAV-induced transduction.
(A) iR26-αS mice were coinjected with Cre- and hM3Dfl-AAVs together with either empty AAVs or AAVs delivering human SOD2 under control of the CAG promoter. (B) Mice treated with Cre-, hM3Dfl-, and empty-AAVs (control mice, n = 8) and animals treated with Cre-, hM3Dfl-, and SOD2-AAVs (SOD2 mice, n = 6) were sacrificed at 5 weeks after AAV injection. Levels of h-αS, mouse αS (m-αS), total (human + mouse) αS (t-αS), and, as housekeeping control, Hprt mRNAs were measured in the left DMnX-MO by qPCR. (C and D) Coronal sections of the MO from control (n = 10) and SOD2 (n = 10) mice were immunostained with either anti–h-αS or anti-RFP (for detection of mCherry-tagged hM3D). Representative images show robust immunoreactivity of either protein in the DMnX-MO. Scale bars, 100 μm. Integrated density measurements were performed in the left (injected side) DMnX; data were calculated as percentage of the mean value in the control group. (E) Coronal sections of the MO were triple-labeled with anti–h-αS, anti-RFP, and anti-SOD2. Colocalization of h-αS and hM3D was seen in DMnX neurons from control mice, whereas all three proteins were coexpressed within DMnX neurons of SOD2 animals; representative images of two cells from a control mouse (top two rows) and two neurons from an SOD2 animal (bottom rows). Scale bars, 10 μm. (F) Control and SOD2 animals were treated with daily injections of saline or CNO during weeks 4 and 5 after AAV injection. They were then sacrificed at the end of week 5. Medullary tissue sections were labeled with anti–c-fos; representative images show an area of the dorsal MO where the central canal and DMnX are delineated with dashed lines. Scale bars, 100 μm. Box and whisker plots show median, upper and lower quartiles, and maximum and minimum as whiskers.

