. 2022 Aug 23;11:e74295. doi: 10.7554/eLife.74295

Figure 1. DTA-mediated ablation of satellite glia in sympathetic ganglia.

(A) Satellite glial cells, immunolabeled with brain lipid binding protein (BLBP, green), progressively ensheathe sympathetic neuron cell bodies, labeled with tyrosine hydroxylase (TH, magenta) in the superior cervical ganglia (SCG) during development. Time points shown are embryonic day 16.5 (E16.5) and postnatal days P1, P14, and P31. Scale bar: 30 μm. (B) Reduced BLBP expression in BLBP:iDTA SCG relative to control ganglia at 14 days after the last tamoxifen injection (14 dpi). Scale bar: 100 μm. (C) Increased apoptosis in BLBP:iDTA SCG (outlined in red dashed line) compared to controls as detected by TUNEL labeling at 5 days post-tamoxifen injection (5 dpi). Scale bar: 100 μm. (D) Quantification of apoptotic cells in SCGs at 5 dpi from n = 4 control and 3 mutant mice. Data are means ± SEM. *p<0.05, t-test. (E) Increased apoptosis of satellite glial cells assessed by Sox10 immunostaining (green) and TUNEL labeling (red) in BLBP:iDTA sympathetic ganglia compared to control at 5 dpi. DAPI channel is shown in gray. Arrowheads indicate TUNEL+;Sox10+ cells. Scale bar: 30 µm. (F) Neuronal apoptosis is similar between BLBP:iDTA and control ganglia at 5 dpi as assessed by TrkA immunostaining (magenta) and TUNEL labeling (green). DAPI channel is shown in gray. Arrowheads indicate TUNEL+;TrkA+ neurons. Scale bar: 30 µm. (G) Quantification of TUNEL+;Sox10+ cells expressed as a % of Sox10+ cells. Data are presented as means ± SEM from n = 6 control and 4 mutant mice, **p<0.05, t-test. (H) Quantification of TUNEL+;TrkA+ cells expressed as a % of TrkA+ cells. Data are presented as means ± SEM from n = 4 mice per genotype, n.s, not significant, t-test. (I) Decreased association of Sox2-labeled satellite glia (green) with TH-positive sympathetic neurons (magenta) in BLBP:iDTA sympathetic ganglia compared to controls at 14 dpi. Arrows indicate Sox2-labeled nuclei of satellite glia associated with TH-positive sympathetic neuron cell bodies, while arrowheads indicate Sox2-labeled nuclei not abutting neuronal soma. Gain in both images has been set to the same level for a better visualization of Sox2-labeled nuclei in mutant ganglia. Scale bar: 30 μm. (J) Quantification of Sox2-positive cells in control and BLBP:iDTA SCGs at 14 dpi. Data are presented as mean ± SEM from n = 5 control and 6 mutant animals, **p<0.01, t-test. (K) TH DAB immunohistochemistry and hematoxylin staining shows fewer satellite glia nuclei (blue) associated with TH-labeled sympathetic neuron cell bodies (brown) in BLBP:iDTA ganglia at 14 dpi. Scale bar: 30 µm. (L) Quantification of glial nuclei associated with neuronal soma. Data are presented as means ± SEM from n = 6 control and 3 mutant animals, **p<0.05, t-test.

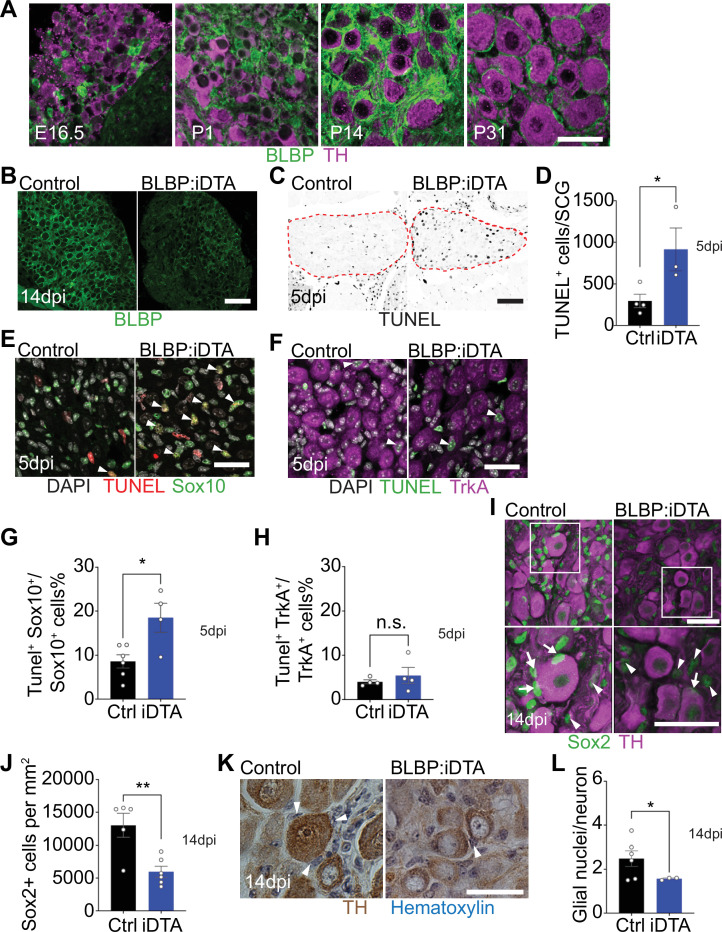
Figure 1—source data 1. Raw data for neuronal and glia apoptosis and glia cell counts.

Figure 1.

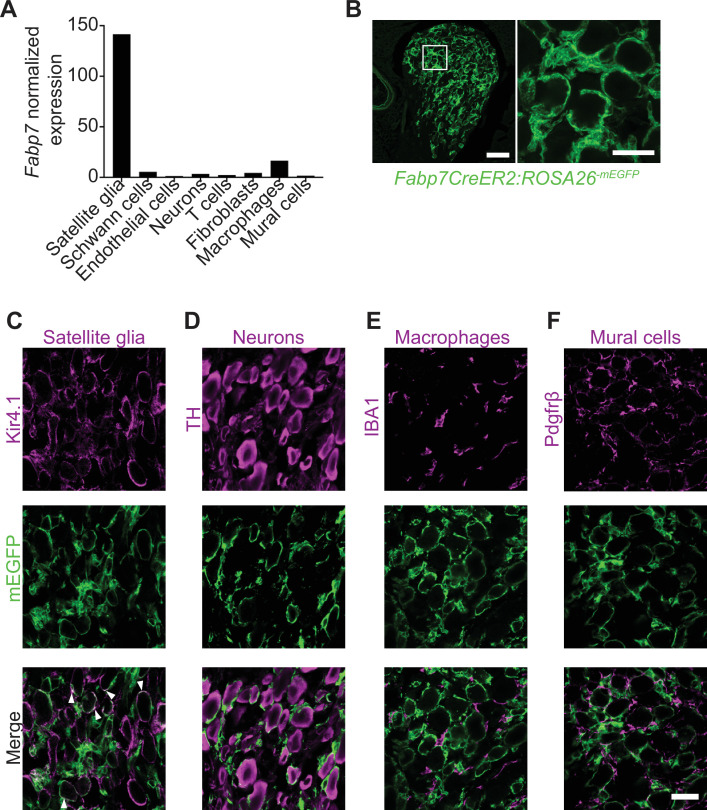
Figure 1—figure supplement 1. Brain lipid binding protein (BLBP) is a specific marker for adult satellite glial cells.

Figure 1—figure supplement 1.

(A) Fabp7 mRNA is enriched in satellite glial cells compared to other ganglionic cell types based on single-cell RNA-sequencing analysis of sympathetic (superior cervical ganglia) and sensory (dorsal root ganglia) from adult mice (postnatal days 30–45) (Mapps et al., 2022). Expression is normalized to cell counts for individual ganglionic cell types. (B) Tamoxifen-induced-mEGFP reporter expression in sympathetic ganglia from Fabp7-CreER2;ROSA26mEGFP mice. Scale bar: 100 μm for left panel and 30 μm for right panel. (C–F) Co-localization of m-EGFP signal with Kir4.1 immunoreactivity (for satellite glia), but not with tyrosine hydroxylase (TH; sympathetic neurons), IBA-1 (macrophages), or Pdgfrβ (vascular mural cells) in Fabp7-CreER2;ROSA26mEGFP sympathetic ganglia. Arrowheads in (C) indicate co-localization of mEGFP and Kir4.1. Scale bar: 30 μm.
Figure 1—figure supplement 1—source data 1. Raw data for normalized Fabp7 in sympathetic ganglia.
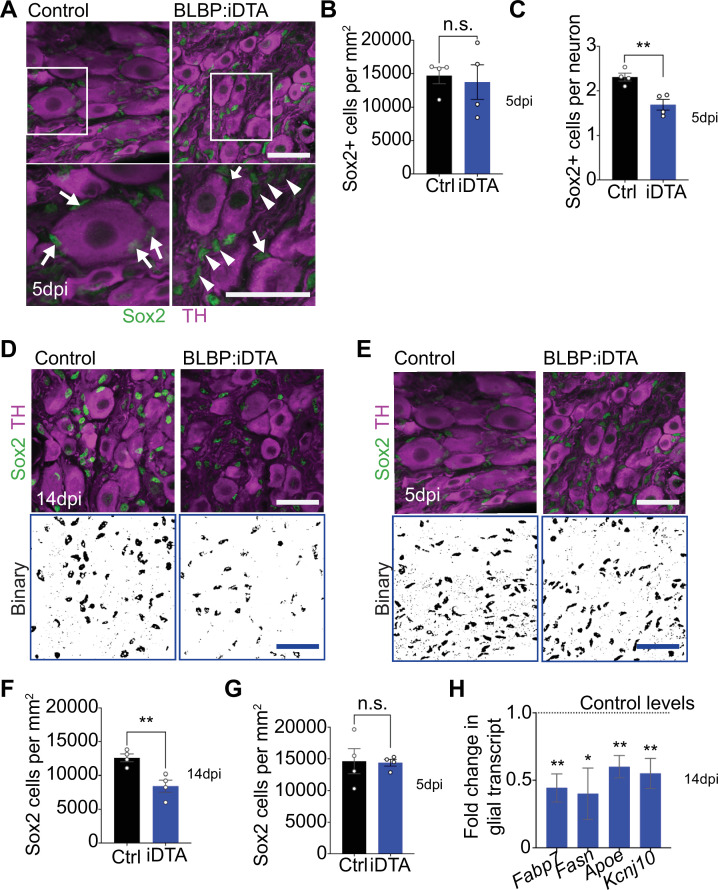
Figure 1—figure supplement 2. Satellite glia ablation in BLBP:iDTA sympathetic ganglia.

Figure 1—figure supplement 2.

(A) Sox2 (green) and tyrosine hydroxylase (TH; magenta) immunostaining in BLBP:iDTA and control sympathetic ganglia at 5 dpi. Arrows indicate Sox2-labeled nuclei associated with sympathetic neuron cell bodies, while arrowheads indicate Sox2-labeled nuclei that are not adjacent to neuronal soma. Scale bar: 30 μm. (B) Quantification shows similar numbers of Sox2-labeled satellite glial cells in control and mutant ganglia at 5 dpi. Data are means ± SEM from n = 4 animals per genotype, **p<0.01, n.s., not significant, t-test. (C) Fewer Sox2-positive satellite glia are found adjacent to neuron cell bodies. Data are means ± SEM from n = 4 animals per genotype, **p<0.01, t-test. (D, E) Binary images of Sox2-immunolabeled cells in BLBP:iDTA and control sympathetic ganglia at 14 dpi (D) and 5 dpi (E). Images were generated by filtering and thresholding using ImageJ. Scale bar: 30 μm. (F, G) Quantification of Sox2-labeled cells in binary images of mutant and control ganglia at 14 dpi (F) and 5 dpi (G). (F) Data are means ± SEM from n = 4 animals per genotype, **p<0.01, t-test, (G) n.s., not significant, t-test. (H) Downregulated expression of satellite glia-enriched transcripts in BLBP:iDTA sympathetic ganglia at 14 dpi as assessed by qPCR analysis. Data are means ± SEM from n = 3–5 animals per genotype, *p<0.05, **p<0.01, t-test with Bonferroni–Dunn’s correction.
Figure 1—figure supplement 2—source data 1. Raw data for glia cell counts and transcript changes in sympathetic ganglia.
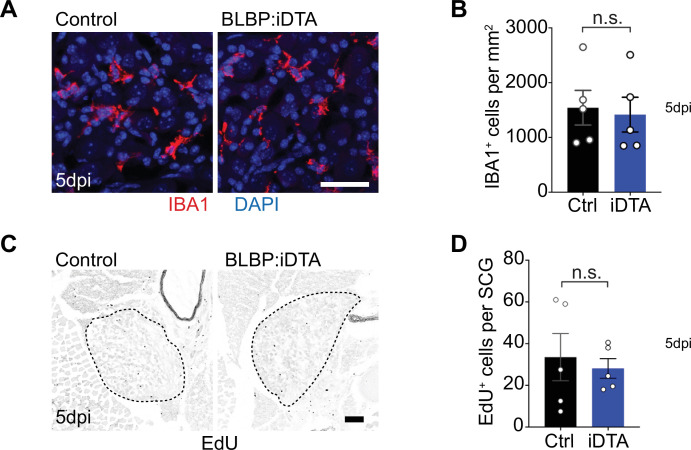
Figure 1—figure supplement 3. Satellite glia depletion does not induce macrophage infiltration or proliferative changes in sympathetic ganglia.

Figure 1—figure supplement 3.

(A, B) Satellite glia depletion does not induce an increase in IBA-1-expressing macrophages in sympathetic ganglia. Scale bar: 30 µm. Data are means ± SEM from n = 5 animals per genotype, n.s., not significant, t-test. (C, D) Proliferation in superior cervical ganglia (SCG) (outlined by dashed line) was not altered by satellite glia depletion as assessed by EDU labeling. Scale bar: 100 µm. Data are means ± SEM from n = 5 animals per genotype, n.s., not significant, t-test.
Figure 1—figure supplement 3—source data 1. Raw data for macrophage and cell proliferation analyses.