. 2022 Aug 23;11:e74295. doi: 10.7554/eLife.74295

Figure 4. Satellite glia-specific Kir4.1 loss impairs norepinephrine (NE) enzyme expression and neuron activity.

(A, B) Reduced Kir4.1 protein and transcript (Kcnj10) in Kir4.1 cKO mice. Scale bar: 30 μm. Data in (B) are mean ± SEM from n = 3 animals per genotype, **p<0.01, t-test. (C, D) Sox2-positive satellite glial cell numbers are unaffected in Kir4.1 cKO SCG. Arrows indicate Sox2-labeled nuclei of satellite glia associated with sympathetic neuron cell bodies. Arrowheads indicate Sox2-labeled satellite glia that are not adjacent to neuronal soma. Scale bar: 30 μm. Data are presented as mean ± SEM from n = 3 animals per genotype, n.s., not significant, t-test. (E, F) Kir4.1 deletion in satellite glia results in an increase in c-Fos-positive sympathetic neurons. Quantification of c-Fos+;TH+ sympathetic neurons as a % of total number of TH+ sympathetic neurons. Scale bar: 100 μm. Quantifications are mean ± SEM from n = 3 animals per genotype, *p<0.05, t-test. (G, H) Downregulation of NE biosynthetic enzymes, TH and DBH, in Kir4.1 cKO sympathetic ganglia. Results are mean ± SEM from n = 3–5 animals per genotype, *p<0.05, ****p<0.0001, t-test with Bonferroni’s correction.

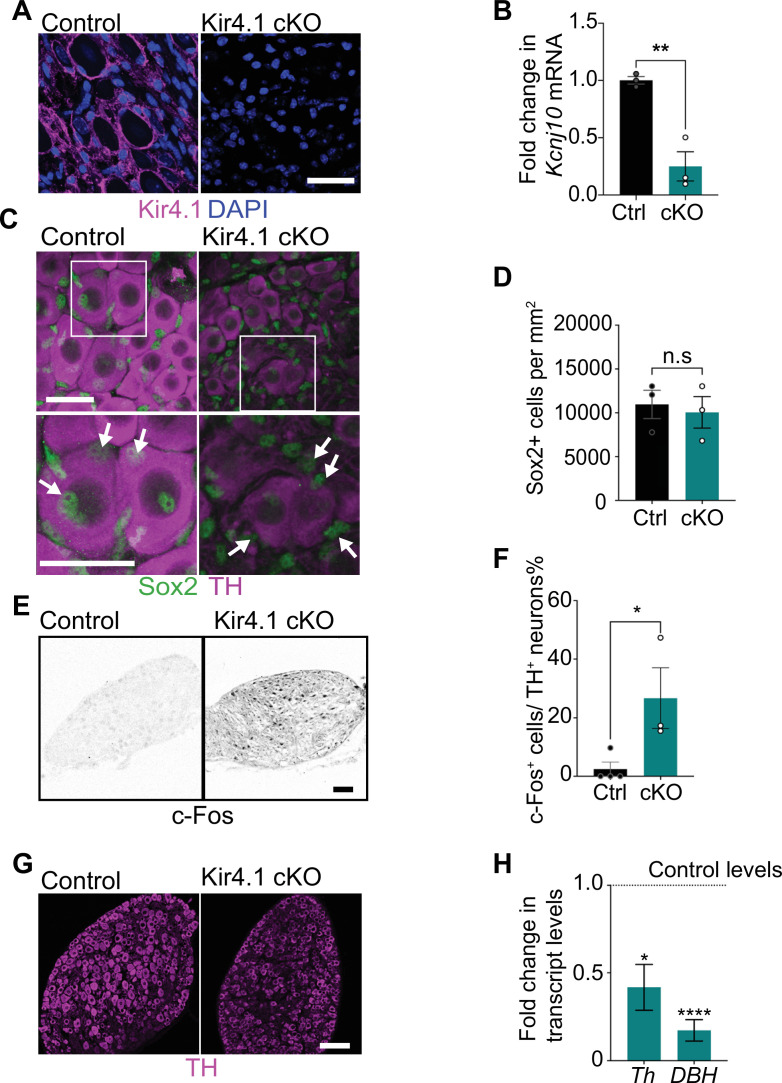
Figure 4—source data 1. Raw data for glia and neuron cell counts and gene expression changes in Kir4.1 mutant and control mice.

Figure 4.

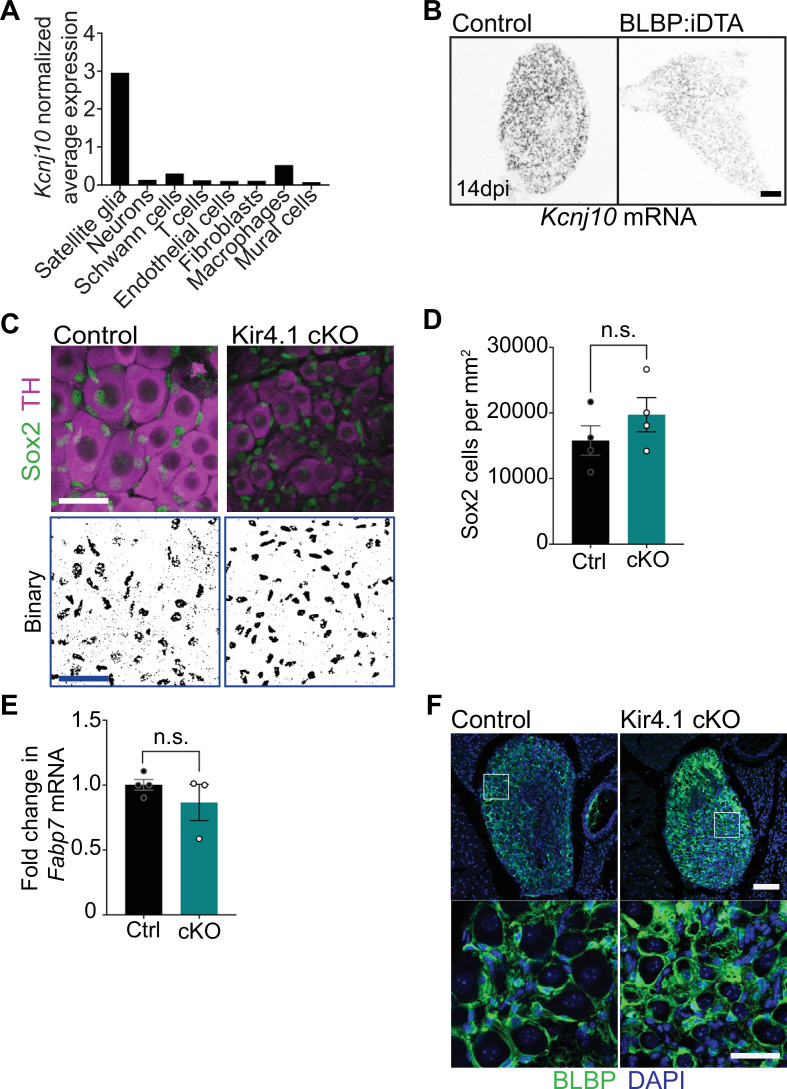
Figure 4—figure supplement 1. Kir4.1 expression and analyses of satellite glia in Kir4.1 cKO mice.

Figure 4—figure supplement 1.

(A) Kcnj10 mRNA is enriched in satellite glia compared to other ganglionic cell types based on single-cell RNA-sequencing analysis of sympathetic and sensory ganglia from adult mice (postnatal days 30–45) (Mapps et al., 2022). Expression is normalized to cell counts for individual ganglionic cell types. (B) Single-molecule fluorescence in situ hybridization (smFISH) shows decreased Kcnj10 mRNA in BLBP:iDTA sympathetic ganglia. Scale bar: 100 µm. (C, D) Binary images and quantifications of Sox2-labeled cells in Kir4.1 cKO and control sympathetic ganglia. Scale bar: 30 µm. Data are presented as mean ± SEM from n = 3 control and 4 mutant animals, n.s., not significant, t-test. (E) Fabp7 mRNA levels are unaltered in Kir4.1 cKO sympathetic ganglia as assessed by qPCR analysis. Data are mean ± SEM from n = 4 control and 3 mutant animals, n.s., not significant, t-test. (F) Brain lipid binding protein (BLBP) immunostaining shows that BLBP protein expression and satellite glial morphologies are not altered in Kir4.1 cKO sympathetic ganglia. Scale bar: 30 µm.
Figure 4—figure supplement 1—source data 1. Raw data for glia cell counts and gene expression changes in Kir4.1 mutant and control mice.