. 2022 Aug 23;11:e74295. doi: 10.7554/eLife.74295

Figure 5. Defects in neuron viability in Kir4.1 cKO mice.

(A) Kir4.1 cKO sympathetic neurons have smaller soma sizes compared to control neurons. Results are mean ± SEM from n = 3 control and 5 mutant mice, ***p<0.001, two-way ANOVA with Bonferroni’s correction. (B) Reduced soma size, represented as median values of soma areas (μm2) of Kir4.1 cKO sympathetic neurons compared to controls. Values are mean ± SEM from n = 3 control and 5 mutant animals, *p<0.05, t-test. (C) Decreased mTOR signaling based on p-S6 immunostaining in Kir4.1 cKO sympathetic ganglia. Scale bar: 100 μm. (D) TUNEL labeling shows increased apoptosis in Kir4.1 cKO SCG (outlined in red dashed line). Scale bar: 100 μm. (E) Quantification of apoptotic cells in control and mutant sympathetic ganglia from n = 3 mice per genotype. Data presented as mean ± SEM **p<0.01, t-test. (F, G) Decreased sympathetic neuron numbers in Kir4.1 cKO mice based on Nissl-staining and cell counts in sympathetic ganglia tissue sections. Results are mean ± SEM from n = 3 control and 4 mutant animals. *p<0.05, t-test. (H) Heart rate is unaffected by Kir4.1 deletion from satellite glia. Results are mean ± SEM from n = 5 control and 6 mutant animals, two-way ANOVA with Bonferroni’s correction. (I) Average heart rate over days 4–7 post-lead implantation. Results are mean ± SEM from n = 5 control and 6 mutant animals. n.s., not significant.

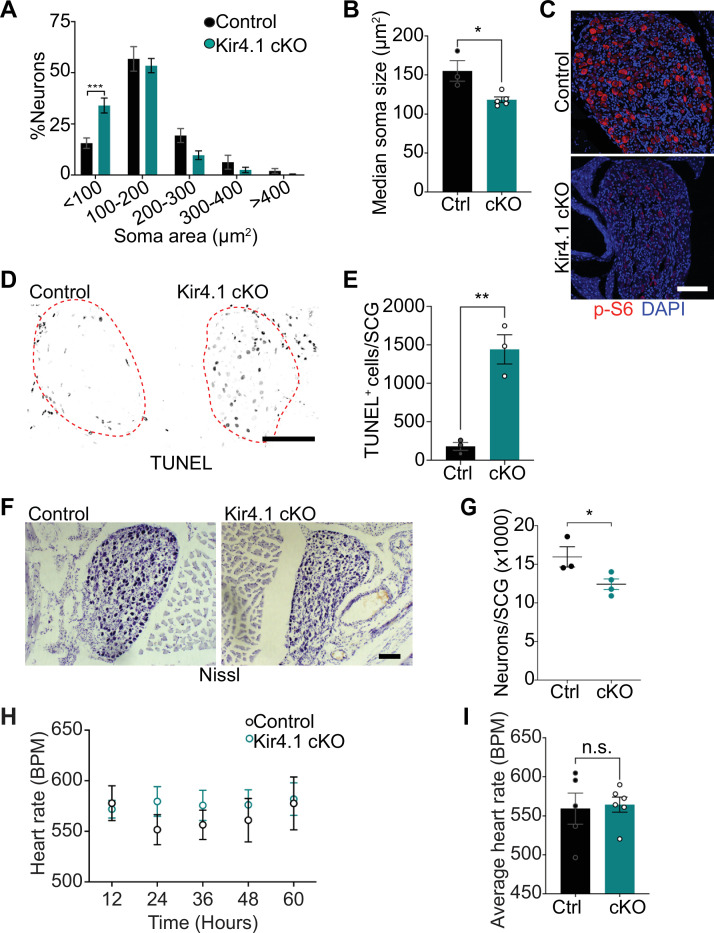
Figure 5—source data 1. Raw data for neuron morphology and heart rate in Kir4.1 mutant and control mice.

Figure 5.

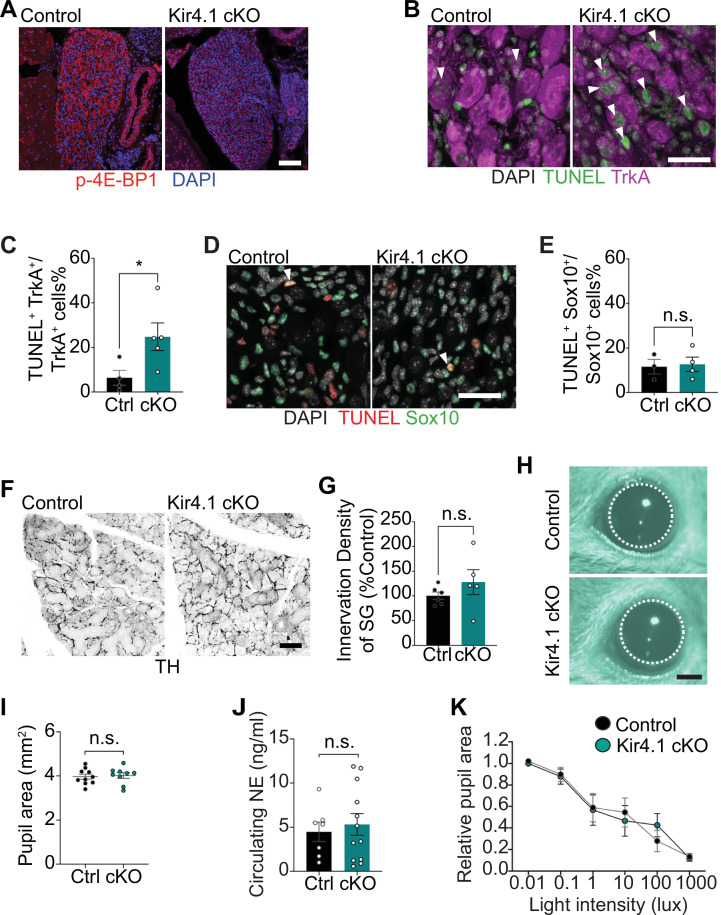
Figure 5—figure supplement 1. Additional morphology and functional analyses in Kir4.1 cKO mice.

Figure 5—figure supplement 1.

(A) Reduced p-4E-BP1 levels as shown by immunostaining in Kir4.1 cKO sympathetic neurons compared to controls. Scale bar: 100 μm. (B) Increased neuronal apoptosis in Kir4.1 cKO ganglia as shown by TrkA immunostaining (magenta) and TUNEL labeling (green). Arrowheads indicate TUNEL+;TrkA+ sympathetic neurons. Scale bar: 30 µm. (C) Quantification of TUNEL+;TrkA+ neurons expressed as a % of total number of TrkA+ neurons. Data are presented as mean ± SEM from n = 4 control and 5 mutant mice, *p<0.05, t-test. (D) Glial apoptosis is unaltered with Kir4.1 loss, assessed by Sox10 immunostaining (green) and TUNEL labeling (red). Arrowheads indicate TUNEL+; Sox10+ cells. Scale bar 30 µm. (E) Quantification of TUNEL+;Sox10+ glial cells expressed as a % of the total number of Sox10+ satellite glial cells. Data are presented as mean ± SEM from n = 6 control and 4 mutant mice, n.s, not significant, t-test. (F) Tyrosine hydroxylase (TH) immunostaining shows normal sympathetic axon innervation in Kir4.1 cKO salivary glands. Scale bar: 100 µm. (G) Quantification of sympathetic innervation density in salivary glands. Data are mean ± SEM from n = 6 control and 5 mutant mice, n.s, not significant, t-test. (H, I) Basal pupil areas are unaffected by satellite glia-specific Kir4.1 deletion. Data are mean ± SEM from n = 10 control and 9 mutant animals, two-way ANOVA with Bonferroni’s correction. (J) Circulating norepinephrine (NE) levels are unaltered with Kir4.1 deletion from satellite glia. Data are mean ± SEM from n = 7 control and 12 mutant animals, n.s., not significant, t-test. (K) Pupil constriction in response to light, indicative of parasympathetic activity, is normal in Kir4.1 cKO mice. Data are mean ± SEM from n = 5 control and 6 mutant animals, two-way ANOVA with Bonferroni’s correction.
Figure 5—figure supplement 1—source data 1. Raw data for neuron and glia morphology, and pupil analyses in Kir4.1 mutant and control mice.