. 2022 Aug 12;11:e77825. doi: 10.7554/eLife.77825

Figure 4. Characterization of Nsp2-SmuCas9 for genome editing.

(A) Schematic diagram of chimeric Cas9 nucleases based on Nsp2Cas9. PI domain of Nsp2Cas9 was replaced with the PI domain of SmuCas9. (B) Sequence logos and (C) PAM wheel diagrams indicate that Nsp2-SmuCas9 recognizes an N4C PAM. (D) Nsp2-SmuCas9 generated indels at endogenous sites with N4C PAMs in HEK293T cells. Indel efficiencies were determined by targeted deep sequencing. NarCas9 is used as a control. Data represent mean ± SD for n=3 biologically independent experiments. (E) Quantification of the indel efficiencies for Nsp2-SmuCas9 and NarCas9. Each dot represents an average efficiency for an individual locus. Data represent mean ± SD for n=3 biologically independent experiments. p values were determined using a two-sided Student’s t test. *p=0.0148 (0.01<p < 0.05).

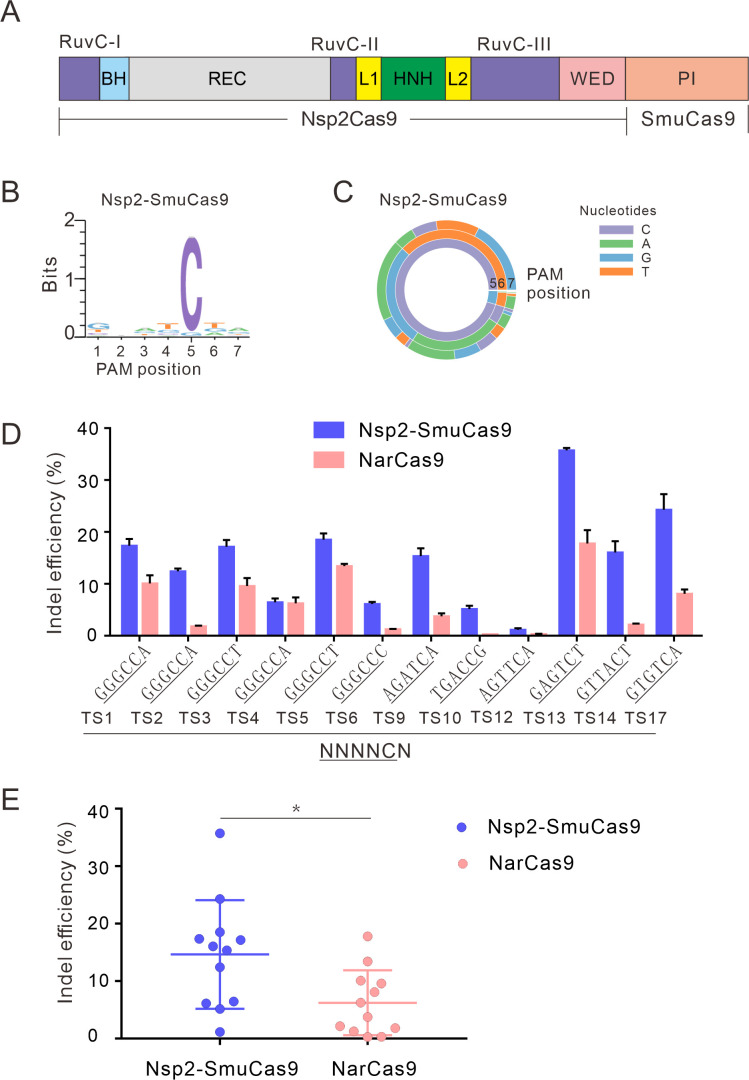
Figure 4—source data 1. Source data for Figure 4D and E.

Figure 4.

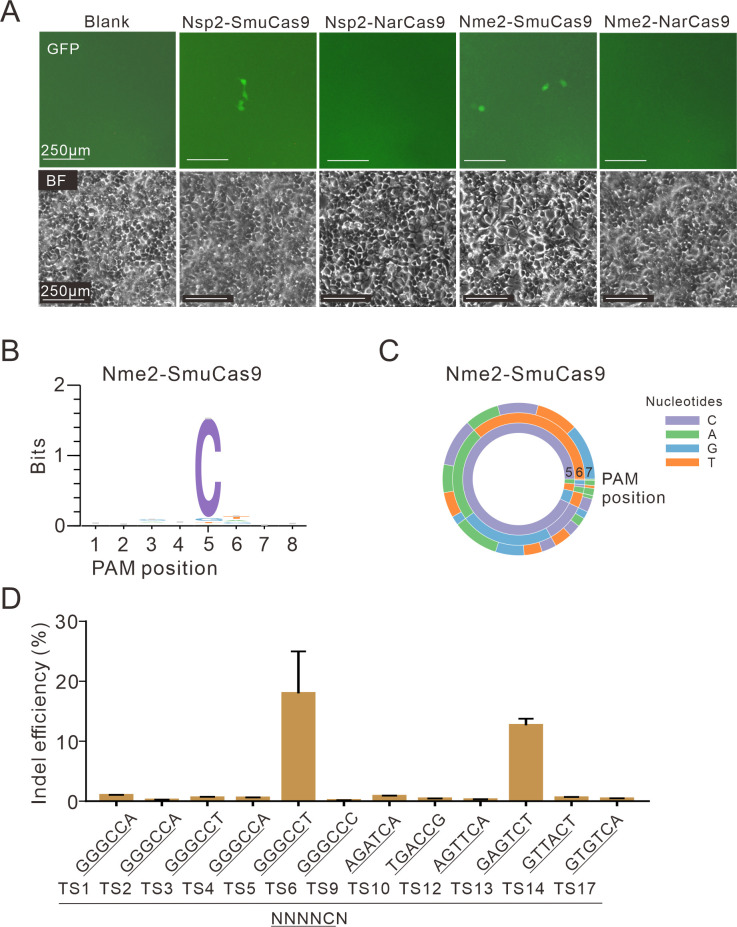
Figure 4—figure supplement 1. Test of 4 chimeric Cas9 activity through a GFP-activation assay.

Figure 4—figure supplement 1.

(A) Nsp2-SmuCas9 and Nme2-SmuCas9 could induce GFP expression. Reporter cells without Cas9 transfection are used as a negative control. Scale bar: 250 μm. (B) Sequence logo and (C) PAM wheel diagram indicate that Nme2-SmuCas9 recognizes an N4C PAM. (D) Nme2-SmuCas9 generated indels at endogenous sites with N4C PAMs in HEK293T cells. Indel efficiencies were determined by targeted deep sequencing. Data represent mean ± SD for n=3 biologically independent experiments.
Figure 4—figure supplement 1—source data 1. Source data for Figure 4—figure supplement 1D.
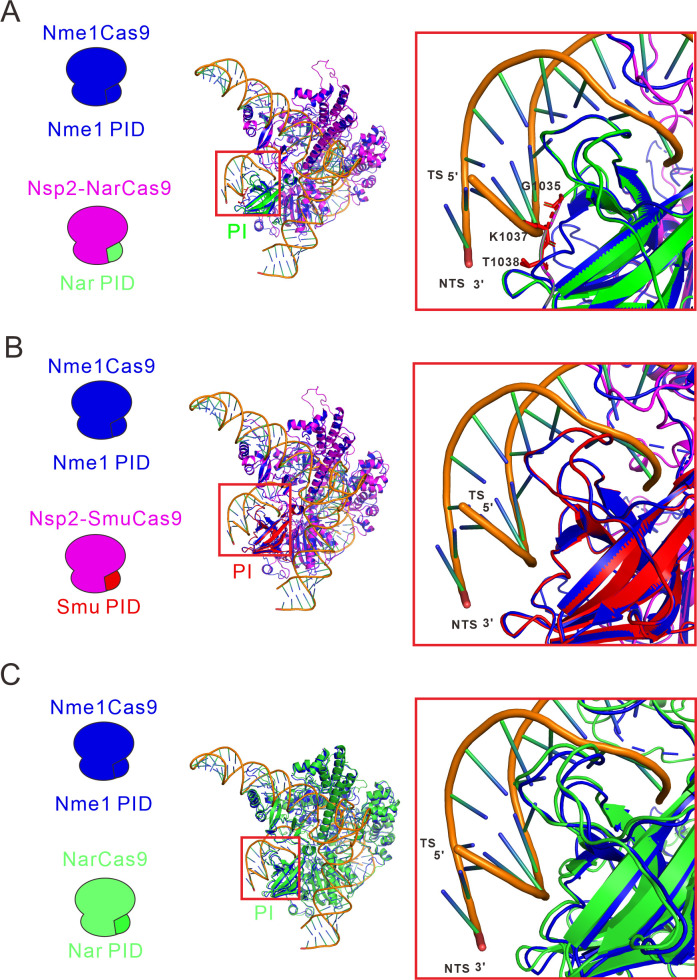
Figure 4—figure supplement 2. Structure of the fully complementary Cas9-sgRNA-dsDNA complex in a catalytic state.

Figure 4—figure supplement 2.

(A) An alignment of the protein tertiary structures of Nsp2-NarCas9 and Nme1Cas9-sgRNA-dsDNA complexes. Blue represents the Nme1Cas9 protein, and green represents the PI domain of NarCas9, PID: PAM identify domain. (B) Align of Nme1Cas9 and Nsp2-SmuCas9. Blue represents the Nme1Cas9 protein, orange represents the Nsp2Cas9 protein, and red represents the PI domain of SmuCas9. (C) Align of Nme1Cas9 and NarCas9. The green represents the NarCas9 protein. TS: target strand, NTS: non-target strand.
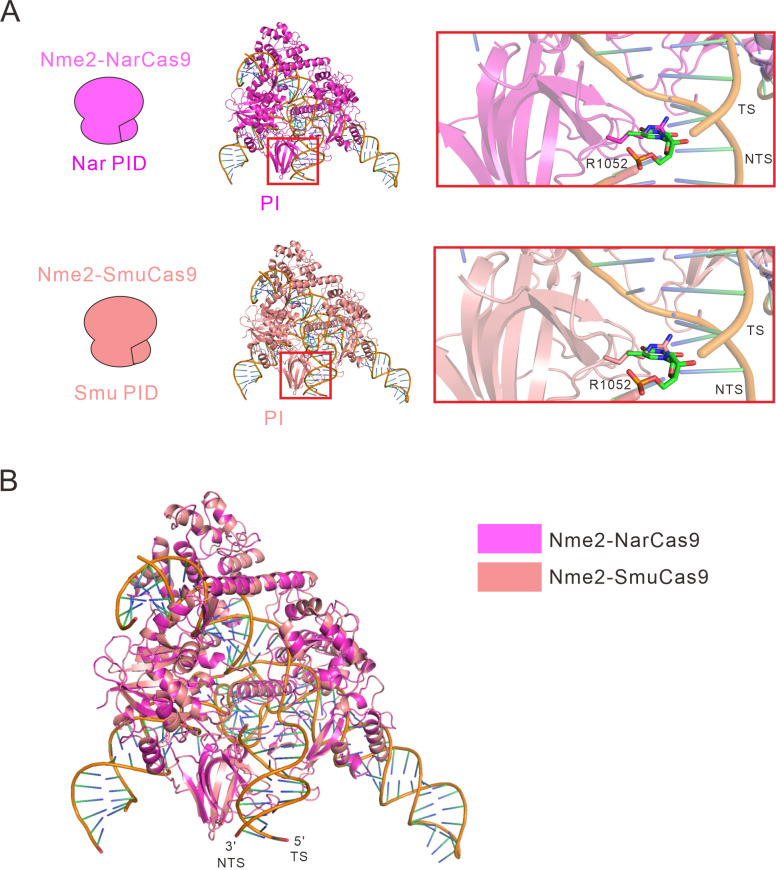
Figure 4—figure supplement 3. Calculated structural models of Nme2-NarCas9 and Nme2-SmuCas9 chimeras.

Figure 4—figure supplement 3.

(A) Calculated structural models of Nme2-NarCas9 and Nme2-SmuCas9 chimeras. In the inactive Nme2-NarCas9 chimera (magenta), R1052 will crash with the DNA strand, leading to a failure of binding with DNA. In the active Nme2-SmuCas9 chimera (salmon), R1052 will also crash with the DNA strand. (B) Overall calculated structures of Nme2-NarCas9 (magenta) and Nme2-SmuCas9 (salmon) chimeras with sgRNA and dsDNA. TS: target strand, NTS: non-target strand.