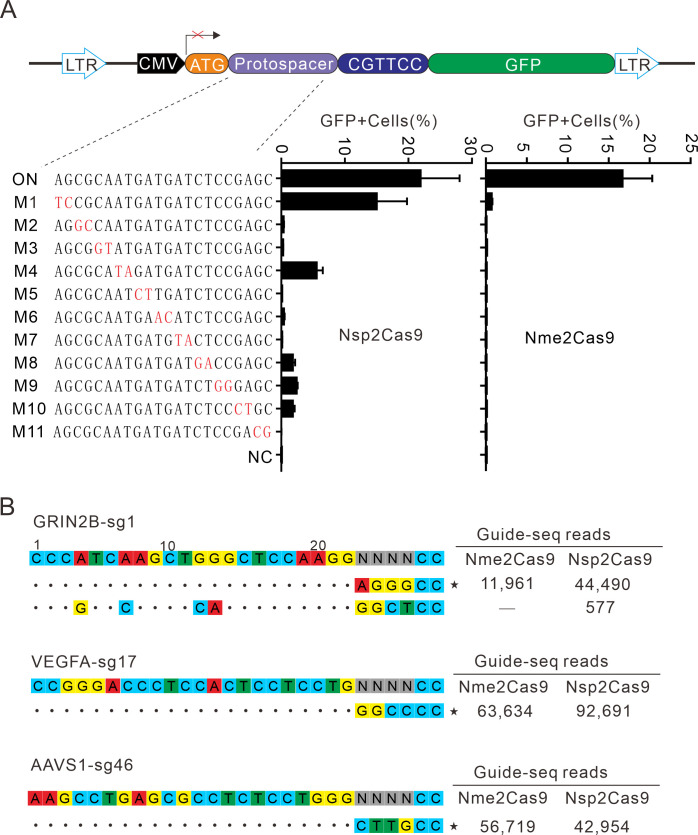
Figure 6. Analysis of Nsp2Cas9 specificity.
(A) Analysis of Nsp2Cas9 and Nme2Cas9 specificity with a GFP-activation assay. A panel of sgRNAs with dinucleotide mutations (red) is shown below. The editing efficiencies reflected by ratio of GFP-positive cells are shown. Data represent mean ± SD for n=3 biologically independent experiments. (B) GUIDE-seq was performed to analyze the genome-wide off-target effects of Nsp2Cas9 and Nme2Cas9. On-target (indicated by stars) and off-target sequences are shown on the left. Read numbers are shown on the right. Mismatches compared to the on-target site are shown and highlighted in color.

