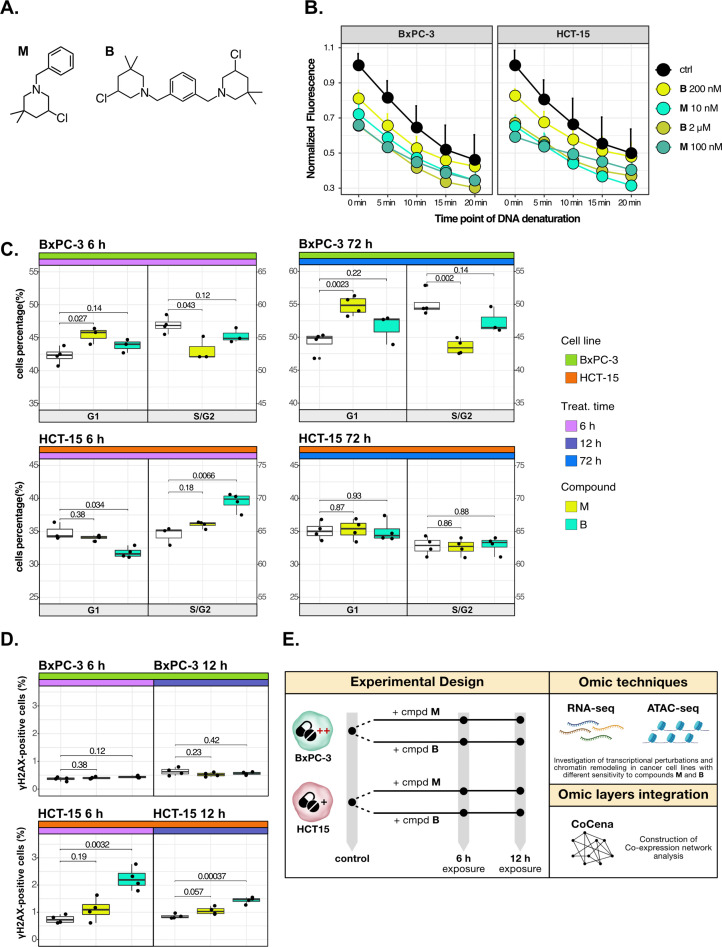
Figure 1. Cancer tropism of 3-chloropiperidines (3-CePs) is not explained by DNA damage.
(A) Chemical structure of the analyzed 3-CePs (M=monofunctional and B=bifunctional). (B) Quantification of genomic DNA damage in BxPC-3 and HCT-15 cells treated with M (10 nM and 100 nM), B (200 nM and 2 µM), or DMSO (dimethyl sulfoxide) 0.5% (ctrl) for 6 hr and analyzed by the fast micromethod single-strand-break assay: alkaline denaturation of DNA is followed in time up to 20 min by monitoring the fluorescence of the dsDNA-specific PicoGreen dye. (C) Cell cycle distribution (accumulation in G1 vs G2/S phases) of BxPC-3 and HCT-15 cells treated with M (10 nM), B (200 nM), or DMSO 0.5% for 6 hr and 72 hr analyzed by FACS (Fluorescence Activated Cell Sorting). At least three biological replicates were obtained per condition and unpaired two-tailed Student’s t-test was performed to assess statistical significance (p<0.05). (D) Analysis of H2AX phosphorylation in BxPC-3 and HCT-15 cells treated with M (10 nM), B (200 nM), or DMSO 0.5% for 6 hr and 12 hr analyzed by FACS. At least three biological replicates were obtained per condition, and unpaired two-tailed Student’s t-test was performed to assess statistical significance (p<0.05). (E) Schematic representation of the adopted omic-based approach.


