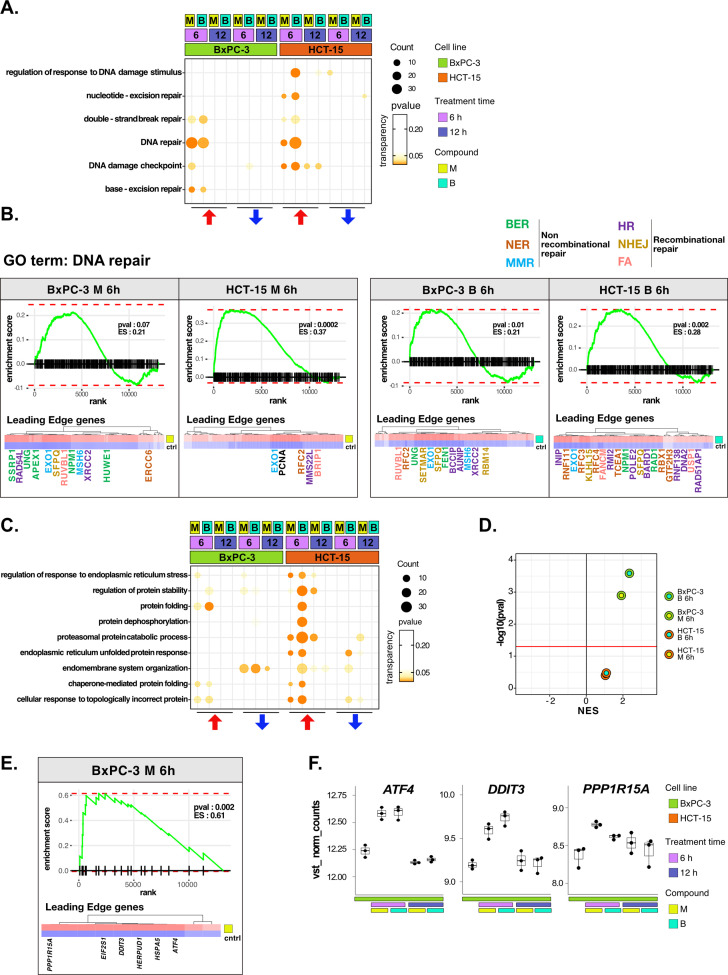
Figure 3. DNA repair and proteostasis are key modulators of the response to 3-chloropiperidines (3-CePs).
(A) Gene set enrichment analysis (GSEA) for terms related to DNA damage and repair performed on differential expression (DE) genes detected in each of the considered treated vs control comparisons. For each gene ontology (GO) term (p<0.05), enrichments in terms of count and p-value are reported. (B) GSEA enrichment plots for the DNA repair pathway obtained from log2FC ranks for each of the considered treated vs control comparisons. The expression of leading edge genes is also shown, where key DE genes are reported with the same color of their associated DNA repair pathways (BER = base excision repair, NER = nucleotide-excision repair, MMR = mismatch repair, HR = homologous recombination, NHEJ = non-homologous end joining, and FA = Fanconi anemia pathway) (Cantor et al., 2001; Charles Richard et al., 2016; Ferretti et al., 2016; Fortini et al., 2003; Fousteri and Mullenders, 2008; Jaafar et al., 2017; Johnson et al., 1999; Kunkel and Erie, 2005; Liu and Kong, 2021; Li and Jin, 2012; Li et al., 2009a; Lou et al., 2017; Lu et al., 2007; Mazin et al., 2010; McVey et al., 2016; Nijman et al., 2005; Niraj et al., 2019; Overmeer et al., 2010; Parsons et al., 2009; Pascucci et al., 2018; Piwko et al., 2016; Poletto et al., 2014; Poulsen et al., 2013; Prasad et al., 2000; Rajendra et al., 2014; Satoh and Hanawalt, 1996; Smirnova et al., 2005; Tellier and Chalmers, 2019; Westermark et al., 2003; Xu et al., 2008; Yard et al., 2016). (C) GSEA for terms related to protein stability and endoplasmic reticulum (ER) load performed on DE genes detected in each comparison. For each GO term, enrichments in terms of count and p-value are reported. (D) NES (normalized enrichment score) and -log10 pval for the log2FC rank-based GSEA enrichment of the GO term PERK-mediated unfolded protein response (UPR) in treated vs control comparisons. (E) GSEA enrichment plot for the PERK-mediated UPR pathway obtained from log2FC rank in the M 6 hr vs control comparison in BxPC-3 cells. The expression of leading edge genes is also shown, where key DE genes of the mentioned pathway are reported. (F) Boxplots showing the expression level of ATF4, DDIT3, and PPP1R15A (vst-transformed normalized counts) in BxPC-3 cells (n=3).


