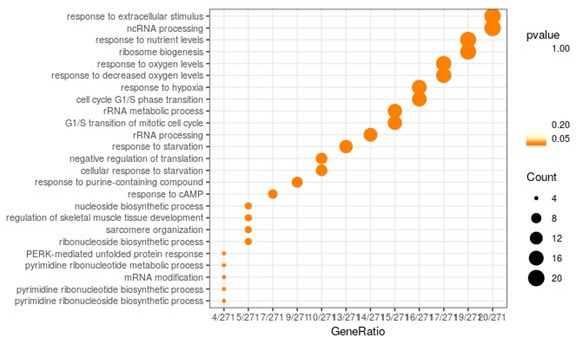
Author response image 1. GSEA analysis on the whole overlap (300 genes) between DE genes from the baseline comparison (BxPC-3 ctrl vs HCT-15 ctrl) and those from the 6 h M treatment comparison, in the sensitive cell line (BxPC-3 M 6 h vs BxPC-3 ctrl).

Gene ratio is defined as the count of genes belonging to the specific GO term over the whole DE genes input.
