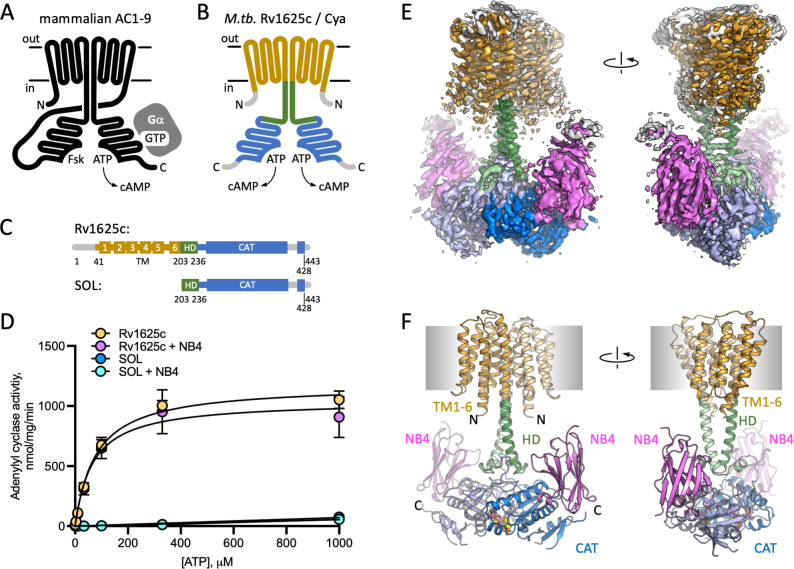
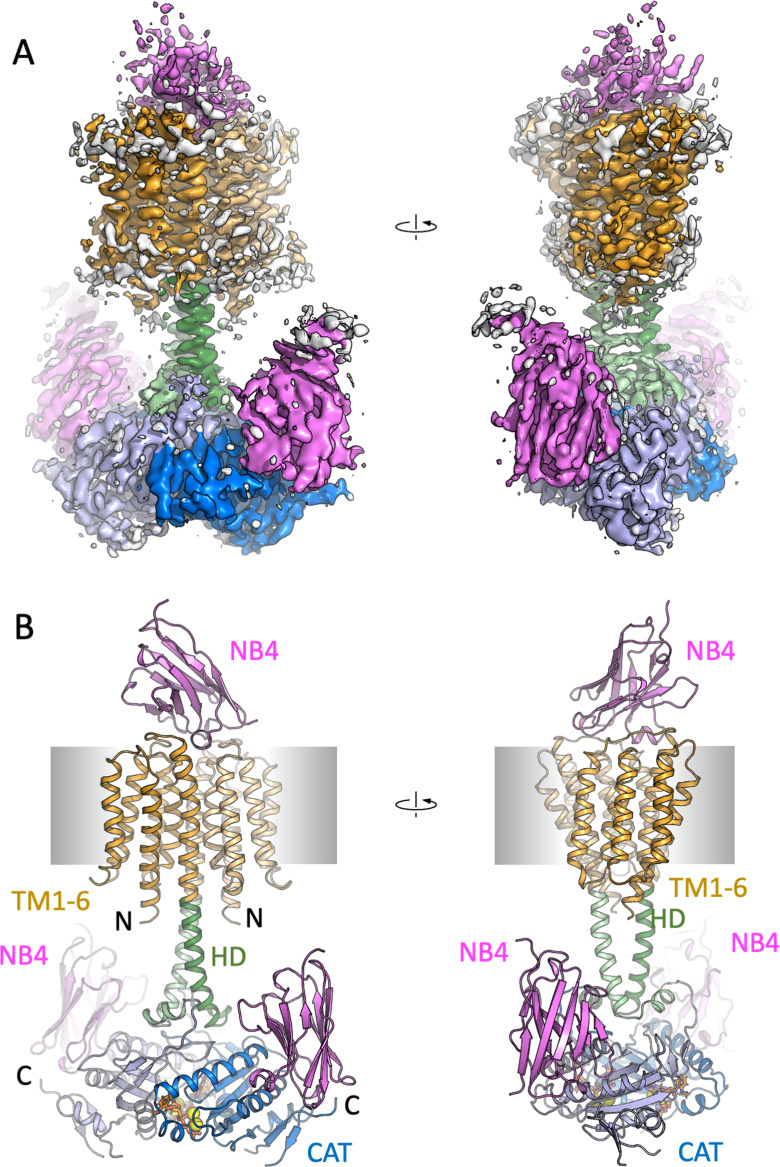
Figure 1. Structure of Cya–NB4 complex.
(A) Schematic representation of the mammalian membrane adenylyl cyclases (ACs), indicating the key elements of AC structure: 12 transmembrane (TM) domains, 2 catalytic domains, an ATP, and a forskolin (Fsk)-binding site. The protein is depicted in a G-protein-bound state. (B, C) A schematic representation of Rv1625c/Cya, illustrating the regions resolved in the cryo-EM structure. The TM region is coloured orange, the helical domain (HD) is green, the catalytic domain is blue. Regions absent in the cryo-EM structure are grey. (D) The activity of the full-length Cya in detergent is similar in the absence (yellow) and in the presence of nanobody NB4 (pink); the soluble domain of Cya (SOL, blue) shows low levels of activity. The activity of SOL in the presence of NB4 (cyan) is similar to SOL alone. For all experiments, the data are shown as mean ± standard error of the mean (SEM) (n = 3; for SOL, n = 6). (E) The density map of Cya–NB4 complex at 3.57 Å resolution, obtained using masked refinement of the best dataset with C2 symmetry imposed. (F) The corresponding views of the atomic model of Cya–NB4 complex, coloured as in B, C. ‘N’ indicates the N-terminal part of the protein; ‘HD’ – helical domain; ‘CAT’ – catalytic domain.

