. 2022 Aug 18;11:e77032. doi: 10.7554/eLife.77032

Figure 5. Extracellular site Ex1 is linked to the adenylyl cyclase activity of Cya.

(A) An illustration of the Ex1 site residues mutated to generate the Ex1-5A mutant, substituting the five indicated residues with Ala. (B) Calculated electrostatic potential of the wild-type Cya. (C) Same as B, for the Ex1-5A mutant. (D) The mutant shows thermostability profile consistent with that of the wild-type protein, based on the observed Tm values in the presence and in the absence of a nucleotide analogue. For experiments in D–F, n = 3; data are shown as mean ± standard error of the mean (SEM). (E) The enzymatic properties of the mutant are substantially affected by the mutation (the dashed red curve corresponds to the fit shown for Cya in Figure 1D for comparison). (F) The affinity of the Ex1-5A mutant for MANT-GTP is reduced (110 and 420 μM, respectively). (G) Limited proteolysis-coupled mass spectrometry (LiP-MS) analysis of Cya and Ex1-5A mutant. The graph indicates sequence coverage and the identified tryptic, semi-tryptic, or non-tryptic peptides. Significantly changing peptides (|log2(FC)|>2; q value <0.001) are marked with a blue dot. A bar within the plot is coloured according to the change in protease accessibility at each peptide (blue = no change, pink = high fold change; absolute log2 transformed fold changes range from 0 to 7.3). (H) A model of Cya coloured according to the bar in E.

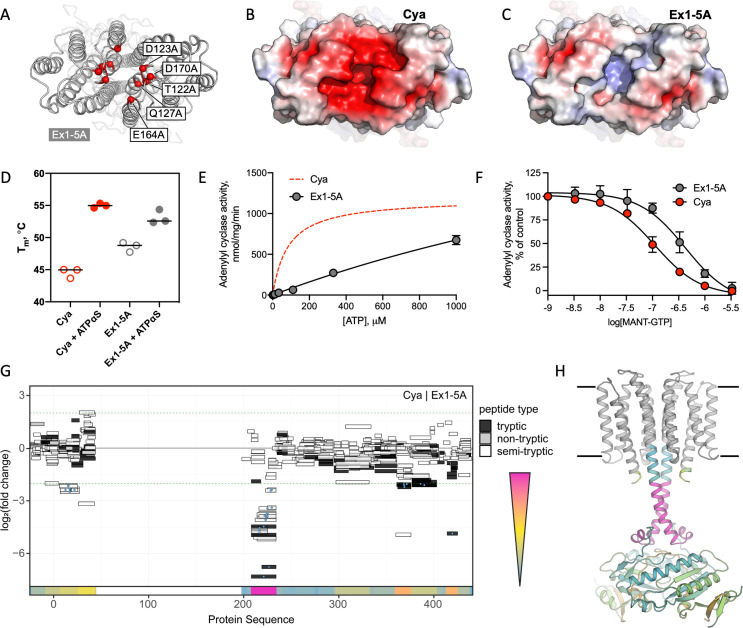
Figure 5—source data 1. Biophysical and biochemical properties of the Ex1-5A mutant (Figure 5D–F).

Figure 5.

Figure 5—figure supplement 1. Purification and stability of Cya mutant Ex1-5A.

Figure 5—figure supplement 1.

(A) Size-exclusion chromatography (SEC) and sodium dodecyl sulfate–polyacrylamide gel electrophoresis (SDS–PAGE) of Ex1-5A. The dashed lines indicate the selected fractions of the purified protein sample. (B) Analysis of protein thermostability, performed using Prometheus Panta instrument, shows that wild-type Cya has an apparent melting temperature of ~42°C, and is stabilized by addition of the nucleotide analogue (ATPαS), resulting in the shift of the first derivative ratio (350/330 nm) peak towards higher temperatures. Here, a representative experiment is shown (the average Tm values are shown in Figure 5). (C) Same as in B, for Ex1-5A mutant. The mutant displays a different melting profile, with additional peaks appearing in the high temperature range. Addition of ATPαS shifts the first peak towards high temperatures.
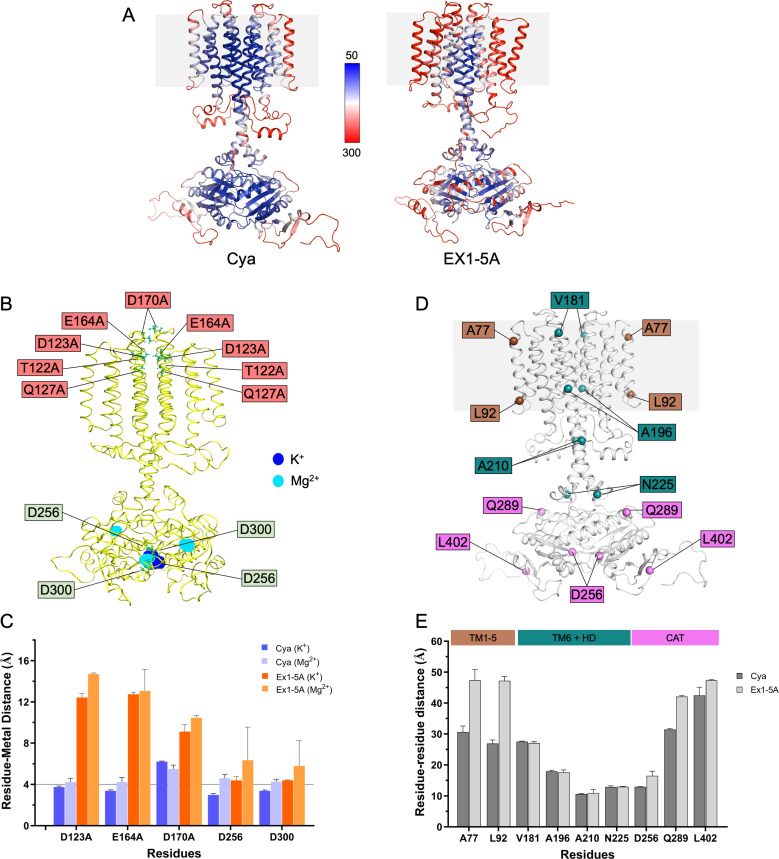
Figure 5—figure supplement 2. Molecular dynamics (MD) simulations of Cya mutant Ex1-5A.

Figure 5—figure supplement 2.

(A) Comparison of B factors of Cya and Ex1-5A mutant derived from MD simulations. (B) Overlay of potassium (blue) and magnesium (cyan) occupancy maps from independent simulations fitted on the reference structure (yellow) showing mutated ex1 site residues and residues involved in metal cofactor biding in catalytic domain. (C) Average distances between key negatively charged residues (or equivalent residues in Ex1-5A mutant) and K+ (light blue) or Mg2+ ions (cyan) during the course of a simulation. (D, E) Comparison of average distances between key residues in Cya monomers. Ex1-5A mutant exhibit increased average distances between D256 residue of each monomer, suggesting the existence of partially open catalytic domain in Ex1-5A mutant.