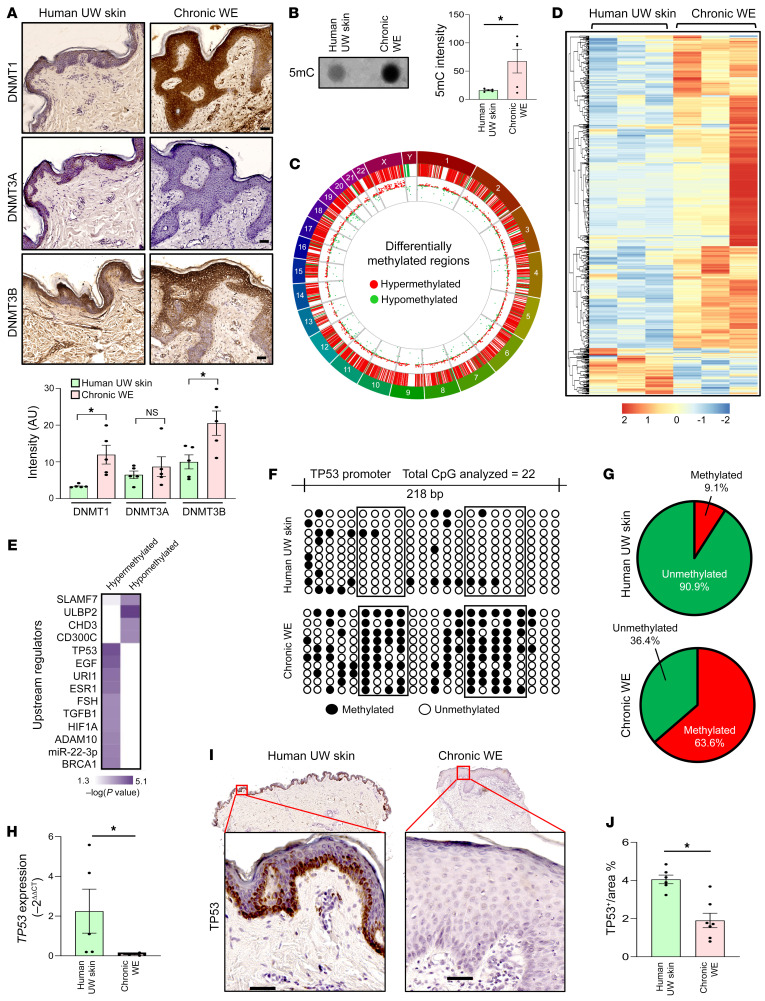
Figure 1. Increased global DNA methylation is strongly associated with human chronic WE tissue.
(A) Representative IHC analysis of DNMT1 (top), DNMT3A (middle), and DNMT3B (bottom) in paraffin sections from human unwounded (UW) skin and chronic wound-edge (WE) tissue. Bottom panel represent the intensity analysis of the images. (Scale bar: 50 μm; n = 5; *P < 0.05, Student’s t test). (B) Dot blot analysis (left) and its intensity analysis (right) of 5-methylcytosine (5mc) in human chronic WE compared with UW skin (n = 5; *P < 0.05, Student’s t test). (C) Circos plot demonstrating the distribution of significant differentially methylated regions (DMRs) associated with 1 kb upstream and 1 kb downstream of Ref-Seq genes in human chronic WE. Chromosome number marked in the periphery. Red lines and dots represent hypermethylated loci, and green lines and dots represent hypomethylated loci in chronic WE. (D) Hierarchical clustering analysis of 4689 significant DMRs associated with Ref-Seq genes in chronic WE. (n = 3; FDR adjusted P < 0.05; 3661 hypermethylated and 1028 hypomethylated in chronic WE tissue) were obtained. (E) IPA upstream regulator analysis of methylation data identified TP53 to be the most significant hypermethylated upstream regulator in chronic WE. (F) Methylation status of a region of TP53 promoter (–1069 bp to –821 bp) analyzed through bisulfite sequencing (methylated CpG, black; unmethylated CpG, white) (n = 10 clones). (G) Distribution of methylated and unmethylated CpGs in TP53 promoter (human UW skin (top); chronic WE (bottom). (H) qRT-PCR analysis of TP53 expression in human chronic WE and skin. (n = 5, 7; *P < 0.05, Student’s t test). (I) Representative IHC analysis of TP53 in sections from human UW skin and chronic WE and (J) intensity analysis of the images. (Scale bar: 50 μm; n = 6, 7; *P < 0.05, by Student’s t test). Data are presented as the mean ± SEM.

