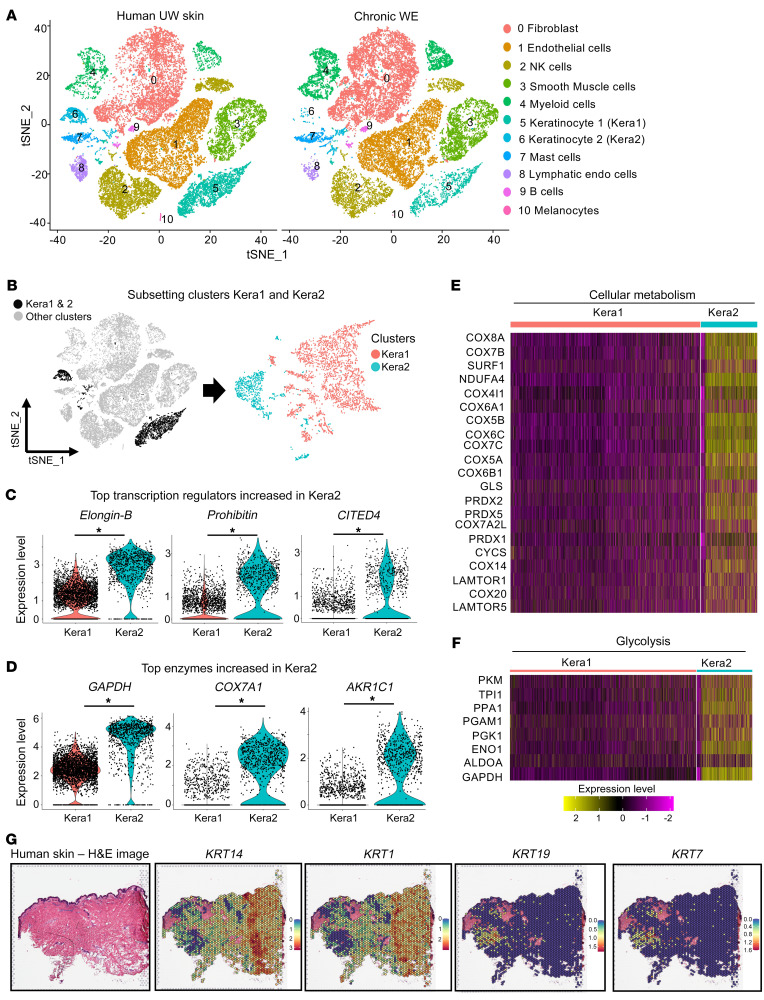
Figure 3. Single-cell RNA-Seq analysis identifies 2 epithelial clusters in human unwounded skin, one of which, high in metabolic genes, is diminished in chronic WE tissue.
(A) tSNE (t-distributed stochastic neighbor embedding) plots showing single-cell transcriptomes of 25,561 cells from UW skin (obtained from 4 individuals) (left) and 25,168 cells from chronic WE (right) (obtained from 3 individuals) analyzed using the 10x Genomics platform. Unsupervised clustering revealed cellular heterogeneity with 11 distinct clusters of cells identified and color-coded. Each cell is represented as a dot. (B) tSNE clustering of the epithelial cells showing 2 identified keratinocytes, Kera1 (cluster 5) and Kera2 (cluster 6), in human UW skin. (C) Violin plots showing the expression level of the top 3 upregulated transcription regulators and (D) top 3 upregulated enzymes in the Kera2 cluster of human UW skin compared with the Kera1 cluster. (*adjusted P < 0.00001, Wilcoxon rank-sum test). (E) Heatmap showing the relative expression of genes involved in cellular metabolism in the 2 keratinocyte clusters (Kera1 and Kera2). (F) Heatmap showing the relative expression of genes involved in glycolysis in the 2 keratinocyte clusters (Kera1 and Kera2). (G) Spatial transcriptomics identified distinct localization of Kera1 (marked by high KRT14 and KRT1 expression) and Kera2 (marked by high KRT19 and KRT7 expression) in human UW skin through spatial feature plots. Scale bar for expression levels: KRT14 (scale: 0–3), KRT1 (scale: 0–2), KRT19 (scale: 0–1.5), and KRT7 (scale: 0–1.6). H&E staining of human skin section (left) was processed for Visium spatial gene expression analysis for classifying tissue based on mRNA levels. Further characterization of the Kera2 cluster is illustrated in Supplemental Figure 4A.

