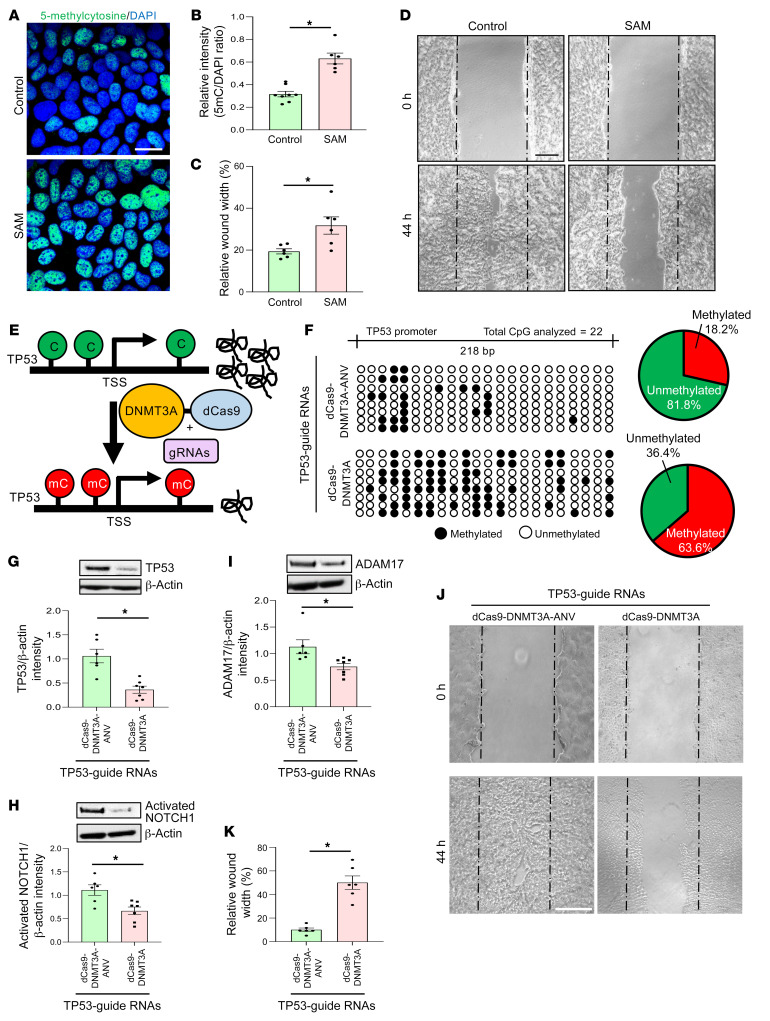
Figure 5. TP53 methylation hinders human keratinocyte migration.
(A) Immunofluorescence analysis of 5-methylcytosine (5mc) in keratinocytes (HaCaT cells) exposed to vehicle control or S-adenosylmethionine (SAM) (80 μM, 48 h) and (B) their intensity analysis. DAPI intensity was used for normalization. (Scale bar: 20 μm; n = 6–8; *P < 0.001, Student’s t test). (C) Quantitation and (D) representative images of scratch-wound migration assay of keratinocytes. Scratch wound migration was performed after 48 hours of pretreatment with vehicle control or SAM (80 μM) and followed for 44 hours after wounding. (Scale bar: 200 μm; n = 6; *P < 0.05, Student’s t test). (E) Schematic diagram showing DNA methylation strategy of TP53 promoter mediated by dCas9-DNMT3A. Transfection efficiency of GFP-labeled plasmids shown in Supplemental Figure 9K through flow cytometry. (F) Left: schematic diagram of TP53 promoter (–1069 bp to –821 bp) analyzed through bisulfite genomic sequencing of DNA. Diagrammatic representation of the promoter methylation status shown (methylated CpG, black; unmethylated CpG, white). Right: Venn diagram showing the distribution of methylated and unmethylated TP53 promoter in HaCaT cells transfected with control (dCas-9-DNMT3A-ANV) (top) and in dCas-9-DNMT3A (bottom) in presence of TP53-guide RNAs. (G) Western blot analysis showing the expression of TP53, (H) activated NOTCH1, and (I) ADAM17 in HaCaT cells transfected with dCas-9-DNMT3A-EGFP or control (dCas-9-DNMT3A-EGFP-ANV) in presence of TP53-guide RNAs. Data expressed as fold change; β-actin used as loading control. (n = 6, 7; *P < 0.05, Student’s t test). Data represented as mean ± SEM. (J) Representative images and (K) quantitation of scratch-wound migration assay of HaCaT keratinocytes. Scratch-wound assay was performed after 48 hours of transfection with dCas-9-DNMT3A or control (dCas-9-DNMT3A-ANV) in presence of TP53-guide RNAs and followed for 44 hours after wounding. (n = 6; *P < 0.05, Student’s t test). Data represented as mean ± SEM.

