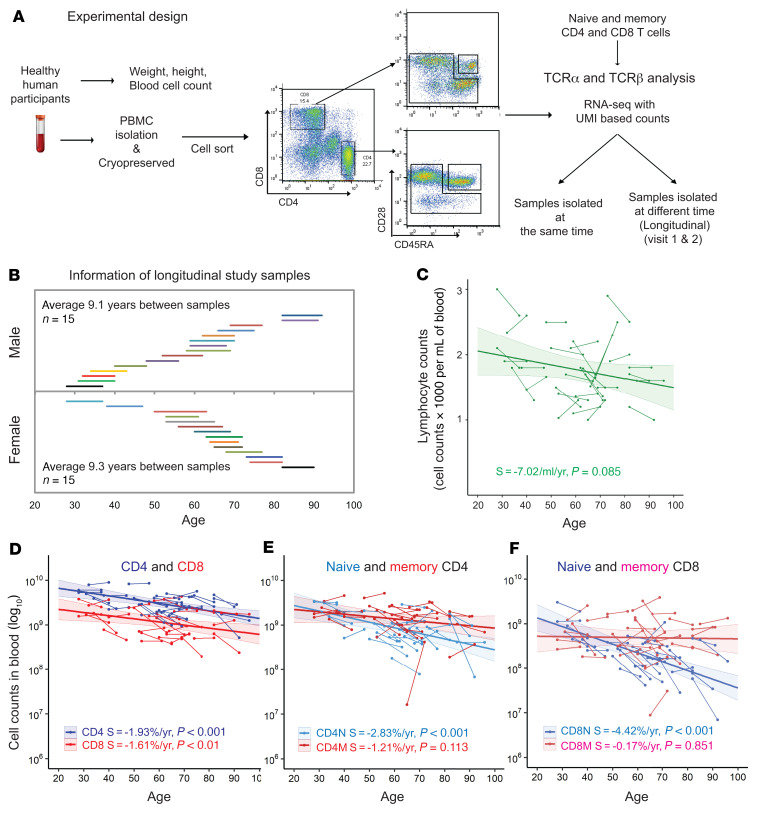
Figure 1. Experimental scheme.
(A) Experimental design. Thirty healthy adults were selected from participants of the Baltimore Longitudinal Study of Aging (BLSA). At each of 2 visits, weight and height were measured and fasting blood was drawn, and PBMCs were isolated and cryopreserved. From each sample, CBC counts were analyzed. For experiments, PBMCs were thawed and stained for CD4, CD8, CD45RA and CD28. Naive and memory CD4+ and CD8+ T cells were isolated by cell sorting for T cell receptor α (TCRα) and TCRβ repertoire analysis. PBMCs were isolated from 3 additional healthy adults and naive and memory CD4+ and CD8+ T cells were sorted in 3–4 aliquots as reproducibility controls. UMI, unique molecular identifier. (B) Age and sex of participants at first and second donation. Each line represents 1 donor, and the length of line indicates years between donations. (C–F) Numbers of lymphocytes, total, naive, and memory CD4+ and CD8+ T cells in samples from 2 donations, with change with age. Cell numbers were based on (a) lymphocyte counts per microliter of blood; (b) percentage of CD4+ and CD8+ T cells and naive and memory cells in lymphocytes, calculated from flow cytometry; and (c) blood volume calculated from donor weight and height adjusted by sex (39). Thin short lines link 2 donations from 1 participant. The thick long line is the trend from MLE analysis. The colored shade around the trend line indicates 95% confidence interval. Unless otherwise noted, values were transformed with log10 for presentation and statistical analysis. Values for slope (S) of the trend line and P values (≤ 0.05 was considered significant) are presented. N, naive; M, memory T cells.

