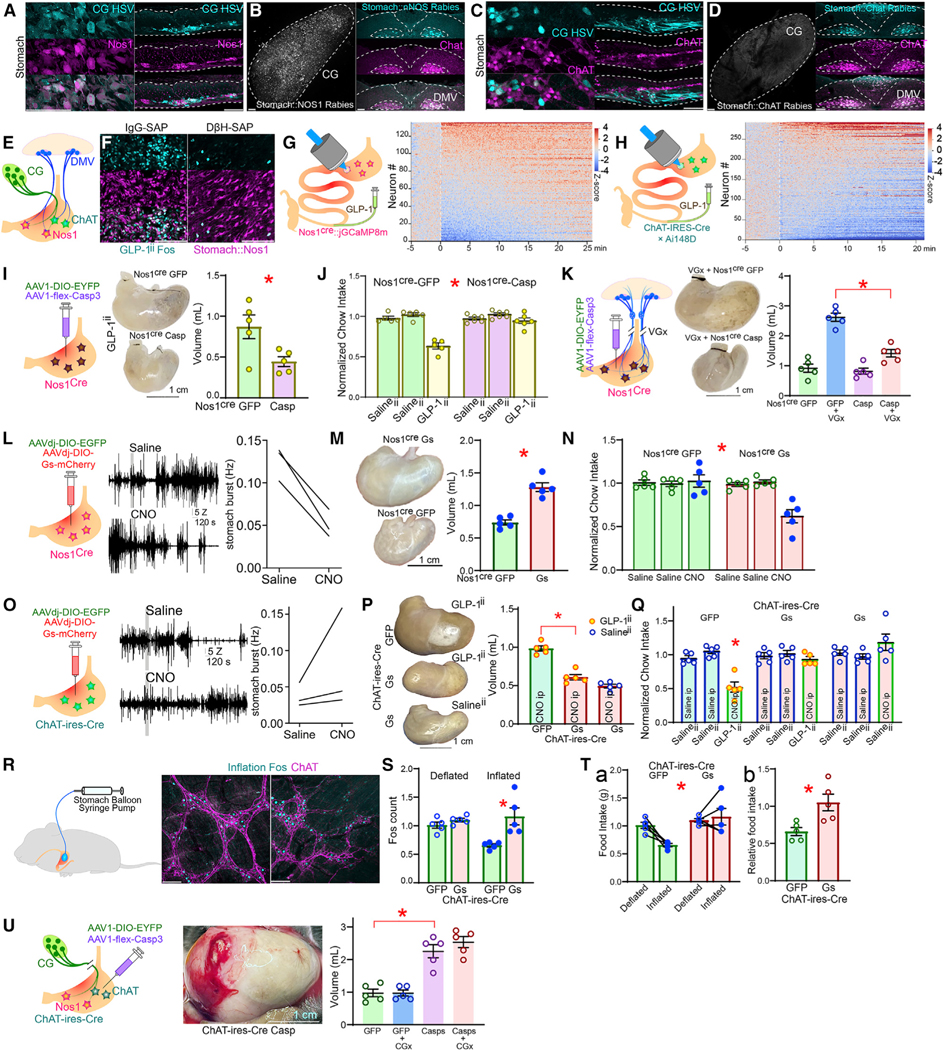
Figure 4. Abdominal sympathetic ganglia recruit Nos1+ gastric neurons to mediate ileal GLP-1 effects.

(A) After gastric infections with the retrograde construct AAVrg-Cre, the polysynaptic, Cre-dependent anterograde HSV strain HSV-LSL-TK-Tomato was injected into CG. Recombination of HSV-LSL-TK-Tomato in CGStom reveals that CG preferentially targets Nos1+ (Nos1Stom) gastric neurons.
(B) Cre-dependent rabies constructs injected into the stomach of Nos1Cre mice labels CGStom and parasympathetic dorsal motor vagal (DMV) neurons.
(C) HSV-LSL-TK-Tomato recombining in CGStom reveals that CG does not target ChAT-gastric neurons (ChATStom).
(D) Cre-dependent rabies constructs injected into the stomach of ChAT-ires-Cre mice labels DMV neurons but not CGStom.
(E) Whereas sympathetic CGStom innervates only Nos1Stom, DMV innervates both Nos1Stom and ChATStom.
(F) GLP-1ii-induced strong and specific Fos in Nos1Stom, an effect abolished by DβH-sap.
(G) Left: injections of the Cre-dependent construct AAV9-syn-FLEX-jGCaMP8m into the stomach of Nos1Cre mice allowed the expression of the genetic calcium sensor GCaMP6f specifically in Nos1Stom. Right: upon implanting the abdominal glass window, intravital imaging revealed that GLP-1ii induces fast and sustained calcium transients in Nos1Stom. Heatmap of Z scores calculated with respect to baseline. T = 0 min: GLP-1ii infusion.
(H) Much less pronounced effects were observed upon similar imaging of ChATStom in ChAT-ires-Cre×Ai148D mice.
(I) Cell-specific ablation (AAV1-flex-Casp3) of Nos1Stom abolishes GLP-1ii-induced gastric expansion, T(8) = 2.709,* p = 0.027.
(J) Same effects for GLP-1ii-induced appetite suppression, two-way mixed RM-ANOVA, infusate × group F(2,18) = 18.790,* p < 0.001.
(K) Cell-specific ablation of Nos1Stom abolishes truncal vagotomy (VGx)-induced gastric bloating, one-way ANOVA F(3,16) = 43.610, p < 0.001; AAV1-DIO-EYFP+VGx versus AAV1-flex-Casp3+VGx Bonferroni * p < 0.001.
(L) Chemogenetic activation of Nos1Stom (Nos1-Gs). Left: representative traces of EMG activity from stomach corpus following either saline (top trace) or CNO (lower trace). Blue insert traces show 1 s EMG, individual spikes shown were counted for plots. Right: aggregate data, average frequency EMG spikes, 20 min following saline or CNO, paired t test T(2) = 8.164, * p = 0.014.
(M) Chemogenetic Nos1Stom activation induces marked stomach distension. Left: representative dissected stomachs; Right: volume of dissected stomachs, 2-sample t test T(8) = 6.960, * p < 0.001.
(N) Chemogenetic Nos1Stom activation reduces 1 h-food intake in Nos1-Gs but not Nos1-GFP, two-way mixed RM-ANOVA, infusate × group F(2,16) = 10.806, * p = 0.001.
(O) Same as (M) and (N) but for chemogenetic activation of ChATStom in ChAT-ires-Cre mice. CNO tended to increase frequency although effect was not significant, T(2) = 0.463, * p = 0.688.
(P) Chemogenetic activation of ChATStom abolishes GLP-1ii-induced gastric bloating, one-way RM-ANOVA, F(2,12) = 66.773, p < 0.001, ChAT-Gs(GLP-1ii) versus ChAT-GFP(GLP-1ii) Bonferroni * p < 0.001.
(Q) Chemogenetic activation of ChATStom abolishes GLP-1ii-induced anorexia, two-way mixed RM-ANOVA, treatment (Salineii versus GLP-1ii) × group F(2,24) = 9.704, p < 0.001; ChAT-Gs(GLP-1ii) versus ChAT-GFP(GLP-1ii) Bonferroni *p = 0.014.
(R–S) Gastric balloon inflation induces Fos in ChATStom, one-way RM-ANOVA, F(3,16) = 7.521, p = 0.002, inflated-GFP versus inflated-Gs, Bonferroni * p = 0.003.
(T) ChATStom activation entirely abolished gastric balloon-induced anorexia, (Ta) Chow intake: two-way mixed RM-ANOVA, inflation 3 group F(1,8)= 8.160, * p = 0.021, and group effect F(1,8) = 10.761, ** p = 0.011. (Tb) Normalized intake reduction upon balloon inflation, T(8) = 3.172, * p = 0.013.
(U) Cell-specific ablation (AAV1-flex-Casp3) of ChATStom causes extreme gastric bloating irrespective of CGx, one-way ANOVA F(3,16) = 30.119, * p < 0.001, AAV1-flex-Casp3 versus AAV1-DIO-EYFP Bonferroni * p < 0.001. Data are represented as mean ± SEM in all figures. Scale bars, 100 μM.
