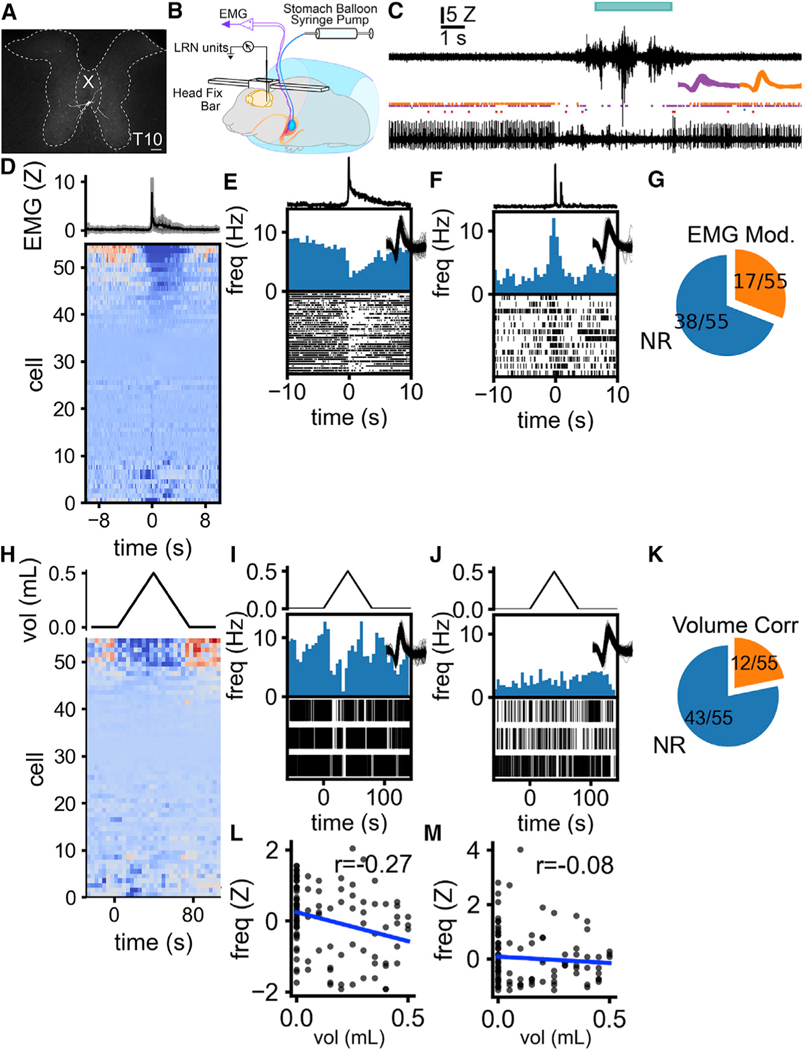
Figure 6. Single neurons in the lateral reticular nucleus detect gastric contractions.
(A) Cre-dependent rabies injections in LRN of VGlut1-ires-Cre mice show that LRNVGlut1 neurons are innervated by large thoracic spinal cord lamina X neurons.
(B) Single neuron activity in LRN and gastric EMG synchronously recorded during intra-gastric balloon inflation in head-fixed, awake mice.
(C) Representative traces of EMG and single-unit activity. Top trace, stomach EMG. The cyan bar above the EMG indicates the detection of a contraction. Rasters, each tick indicates the occurrence of a spike from a discriminated unit at the recording site. Two units are presented in purple and orange. Bottom trace, activity from the recording site from which rasters were constructed.Inset traces, waveforms of sorted units.
(D–F) LRN cells are modulated in concert with stomach contraction. (D) LRN cell activity aligned with the initiation of a stomach contraction. The top trace is a triggered average of EMG activity. (E) The representative individual unit that is inhibited during stomach contraction. The top line plot shows the burst-triggered EMG from the stomach. The lower histogram and raster show the change in unit activity aligned to the onset of individual contractions. (F) Representative individual unit excited during stomach contraction.
(G) The proportion of single units showing significant changes in firing rate in response to stomach contractions. 17/55 cells showed a significant change in firing rate between these periods.
(H–J) Some LRN cells are inhibited during stomach distension. (H) LRN cell activity aligned to a programmed sequence of inflation then deflation of a balloon implanted in the stomach. The top line plot shows the volume of the stomach balloon. (I) The single unit that is negatively correlated with the balloon volume, same cell as (E). The top line shows balloon volume. Lower histogram and raster show changes in unit activity during balloon inflation and deflation. (J) The single unit that has no correlation with balloon volume, same cell as (F).
(K) The proportion of single units that show a significant correlation with balloon volume. 12 cells showed significant correlations between firing rate and balloon volume.
(L) Example of the correlation between balloon volume and firing rate for the unit shown in (E) and (I) (r = −0.27, p = 0.0059).
(M) Example of the correlation between balloon volume and firing rate for the unit shown in (F) and (J) (r = −0.078, p = 0.43). Scale bars, 100 μM.
See also Figure S6.

