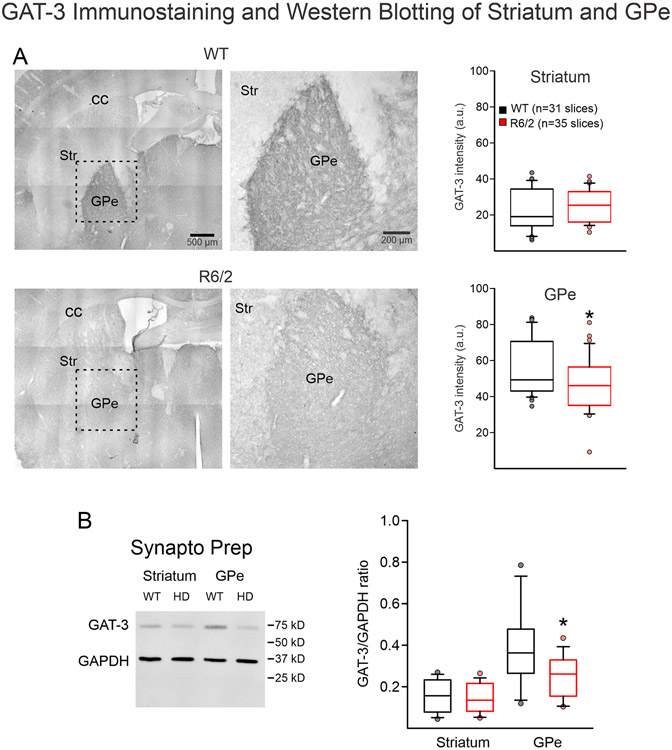
Fig. 3.
A. Bright field tiled and magnified images (left) [dashed line box shows magnified region on the right] of GAT-3 immunostaining of striatum (Str) and GPe in WT vs. R6/2 mice showed no change in Str GAT-3 expression levels, but a significant decrease in GAT-3 expression in the GPe. Bar graphs (right) show quantitative data. B. Synaptoneurosome preparations of Str or GPe from WT vs. R6/2 mice showed no change in GAT-3 expression in the Str, but a statistically significant decrease of GAT-3 expression in the GPe.

