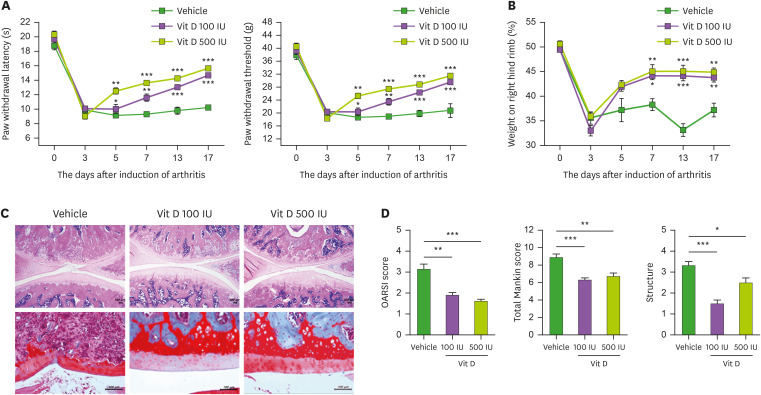
Figure 1. The therapeutic effect of vitamin D in MIA-induced-OA model. (A) Pain behavior was analyzed as PWL (left) and PWT (right) in non-induced rats (wild type, n=4), and vehicle-treated (n=4), 100-IU vitamin-D-treated (n=4), and 500-IU vitamin-D-treated (n=4) MIA-induced OA rats. (B) Weight bearing was measured in all groups. (C) H&E (top) and safranin O (bottom) stained joints. (D) Bar graphs show averaged OARSI scores (left), Mankin scores (center), and structures (right). Data are presented as means ± SD.
*p<0.05; **p<0.005; ***p< 0.001.

