
Figure 6.
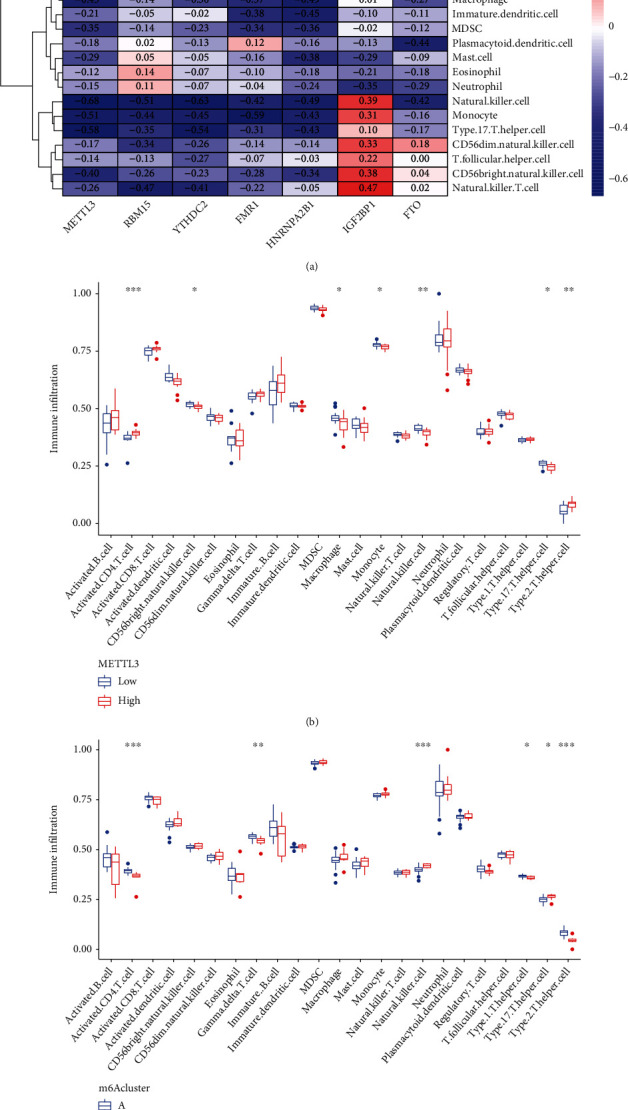
Comparison of the ssGSEA scores. (a) Infiltrating immune cells and the seven major m6A regulators have been found to have a correlation with one another. (b) Differences in the quantity of immune cells invading the tissue between groups with high and low levels of METTL3-associated protein expression. (c) Different patterns of immune cell infiltration were seen in clusterA and clusterB.