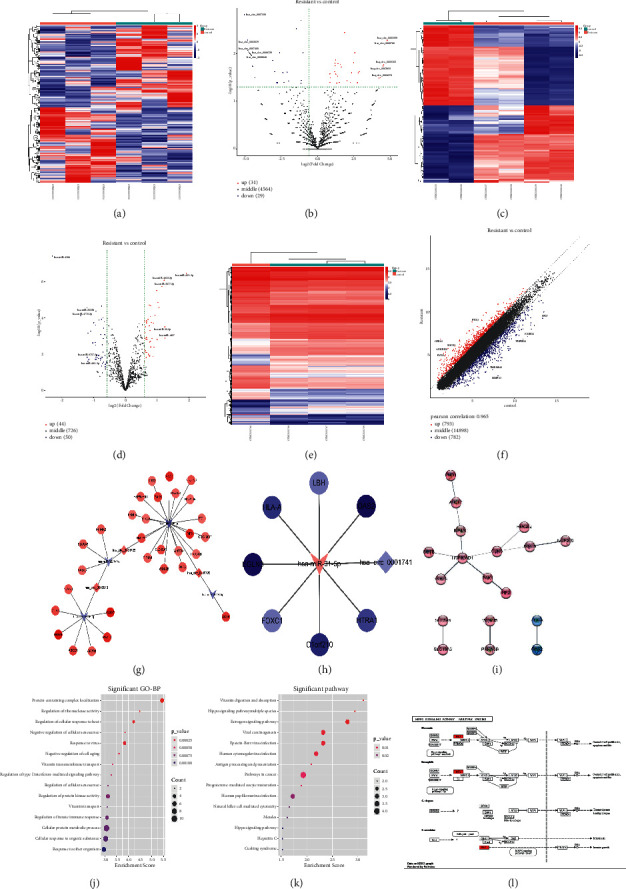
Figure 1.

Identification of circRNA, miRNA, and mRNA. (a–f) The heat map and volcano map or scatter plot of genes with significant differences. (g–h) circRNA-miRNA-mRNA interaction network of the upregulated and downregulated circRNAs. (i) PPI interaction network of the significantly different genes located in the two ceRNA networks. (j) The enriched GO terms of the differentially expressed genes. (k) The enriched KEGG pathways of the differentially expressed genes. (l) The differential genes were mapped in significantly enriched pathways using Pathview package.
