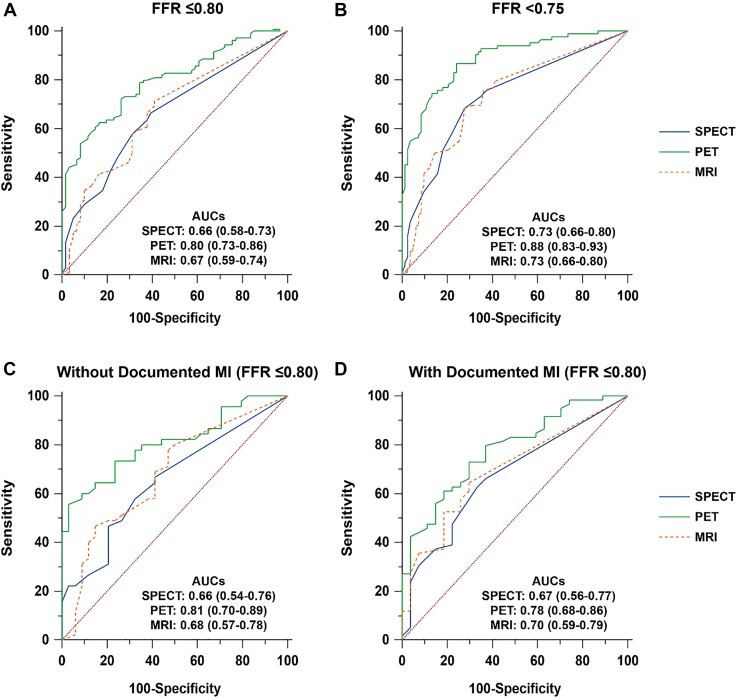
Figure 3.
Discriminative ability of qualitative and quantitative myocardial perfusion imaging modalities for the detection of significant coronary artery disease on a per-patient basis. Receiver operating characteristic curve analysis with corresponding area under the curves and 95% confidence intervals displaying the performance of single-photon emission computed tomography, positron emission tomography, and magnetic resonance imaging as referenced by an (A) fractional flow reserve ≤0.80 and (B) fractional flow reserve <0.75. Similarly, subgroup analyses are shown in patients (C) without a documented myocardial infarction and (D) with a documented myocardial infarction. AUC, area under the receiver operating characteristic curve; other abbreviations are as in Figure 1.

