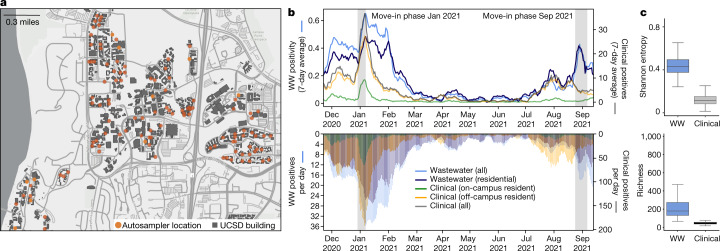
Fig. 1. Campus sampling locations and SARS-CoV-2 testing statistics.
a, Geospatial distribution of the 131 actively deployed wastewater autosamplers and the corresponding 360 university buildings on the campus sewer network. Building-specific data have been de-identified in accordance with university reporting policies. b, Campus wastewater (WW) and diagnostic testing statistics over the 295-day sampling period (positivity is the fraction of WW samplers with a positive qPCR signal). c, Virus diversity in wastewater and clinical samples; boxplots of Shannon entropy (top) and richness (bottom) for each sample type (n = 153 WW—a subset chosen to maximize sample independence; see Methods—and n = 5,888 clinical). Box edges specify the first and third quartiles, the solid line indicates the median, and the whiskers delimit the maximum and minimum values. Map in a is the intellectual property of Esri and its licensors and are used herein under license. Copyright © 2022 Esri and its licensors. All rights reserved.

