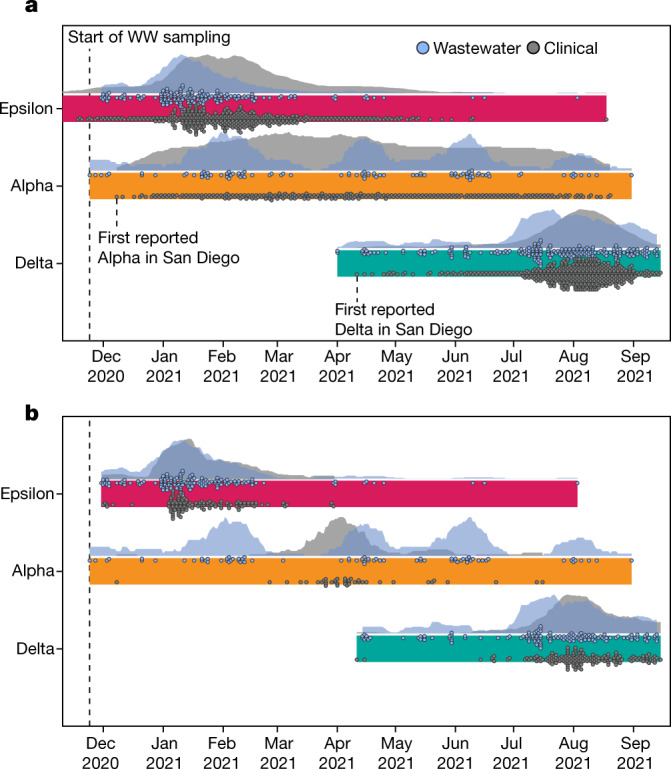
Fig. 3. Freyja recovers early and cryptic transmission of SARS-CoV-2 variants of concern.

a, Timeline and normalized epidemiological curves for VOC detection in both wastewater and clinical sequences from San Diego County (includes wastewater samples collected from Point Loma wastewater treatment plant, UCSD, as well as public schools in the San Diego districts) for the three major VOCs in circulation during the sampling period (n = 475 wastewater, n = 22,504 clinical). Both Alpha and Delta variants are detected first in wastewater before clinical samples. Markers for clinical detections correspond to the ceiling of the daily detection count divided by 30 (for example, 1–30 samples = one marker, 31–60 = two markers), whereas wastewater markers correspond to a single detection. b, Timeline and epidemiological curves for VOC detection in the campus samples (n = 364 wastewater, n = 333 clinical). Markers correspond to a single detection event for both clinical and wastewater surveillance. All wastewater detections correspond to an estimated VOC prevalence of at least 10%.
