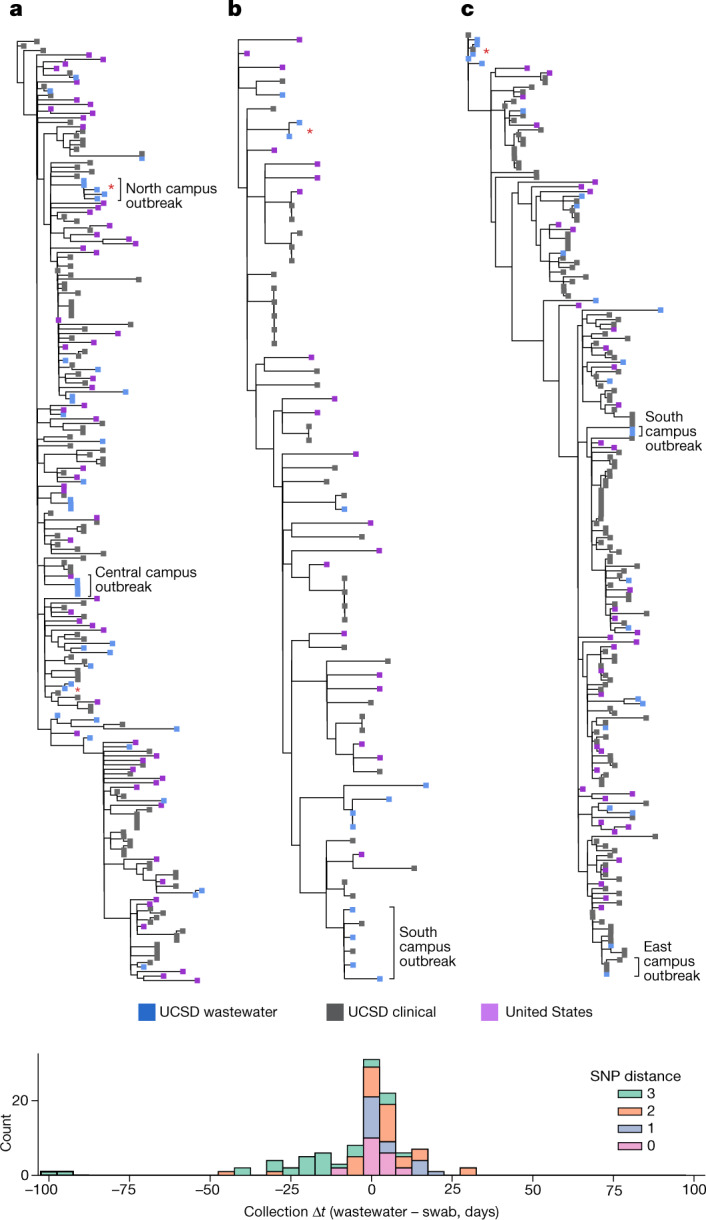
Fig. 6. Wastewater identifies clinically known and unknown virus transmission.

a–c, Maximum likelihood phylogenetic trees for each of the dominant VOCs (Epsilon (a), Alpha (b) and Delta (c)) using high-quality samples obtained at UCSD, as well as a representative set of sequences from the entire United States. Wastewater sequences from the same sampler that differ by one or fewer SNPs are denoted with a red asterisk. For all sequences, consensus bases were called at sites with more than 50% nucleotide frequency. Location information is provided for select outbreaks. d, Pairwise comparison of collection date for matching and near-matching wastewater and nasal swab samples obtained at UCSD. Positive values indicate earlier collection in nasal swabs and negative values indicate earlier detection in wastewater.
