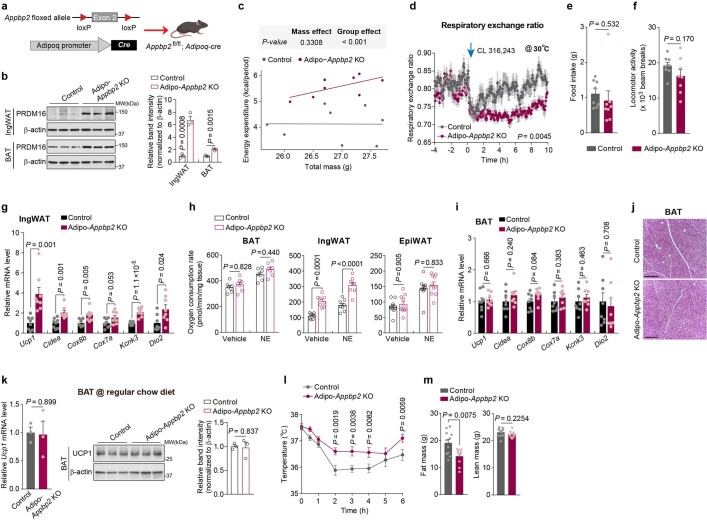
Extended Data Fig. 12. Characterization of Adipo-Appbp2 KO mice.
a, Schematic illustration of Adipo-Appbp2 KO mice. The cartoon was created with Biorender. b, Left: Immunoblotting of indicated proteins. n = 3 per group. Right: Quantification of PRDM16 protein levels normalized to β-actin levels. n = 3 per group. c, Regression-based analysis of energy expenditure in Fig. 5d by CaIR-ANCOVA. d, Respiratory exchange ratio of mice in Fig. 5d. e, f, Total food intake (e) and locomotor activity (f) in Fig. 5d. g, Relative mRNA levels of indicated genes in the IngWAT in Fig. 5d. h, OCR in indicated tissues in Fig. 5d normalized by per mg of tissue. n = 7 for BAT in both groups, n = 8 for IngWAT in both groups, n = 10 for EpiWAT in both groups. i, Relative mRNA levels of indicated genes in the iBAT in Fig. 5d. n = 8 per group. j, H&E staining of iBAT in Fig. 5d. Scale bar, 210 μm. Representative images from two biologically independent samples. k, Left: Relative mRNA levels of Ucp1 in the iBAT of mice on a regular chow diet at room temperature. n = 3 per group. Middle: Immunoblotting of UCP1 protein in the BAT. n = 3 per group. Right: Quantification of UCP1 protein levels normalized to β-actin levels. n = 3 per group. l, Changes in rectal temperature of mice during adaptation to 8 °C from 30 °C. n = 7 (Adipo-Appbp2 KO), n = 6 (Control). m, Fat mass and lean mass at 8 weeks of HFD. n = 10 (Adipo-Appbp2 KO), n = 11 (Control). Representative results in b, k from two independent experiments. Gel source data are presented in Supplementary Fig. 1. b-i, k-m, biologically independent samples. Data are mean ± s.e.m.; two-sided P values by unpaired Student’s t-test (b, e–g, i, k, m), one-way ANOVA followed by Tukey’s test (h) or two-way repeated-measures ANOVA (d) followed by Fisher’s LSD test (l).

