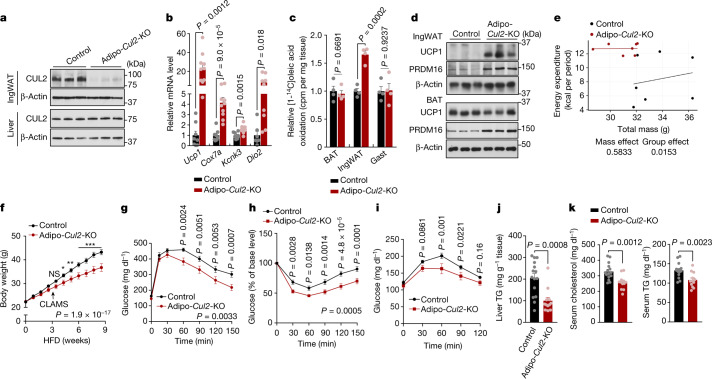
Fig. 2. Fat-specific loss of Cul2 counteracts diet-induced obesity, insulin resistance and dyslipidaemia.
a, Immunoblot analysis of CUL2 protein in the inguinal WAT (IngWAT) and liver of Adipo-Cul2-KO and littermate control mice. n = 3 per group. b, Relative mRNA levels of the indicated genes in the inguinal WAT of Adipo-Cul2-KO mice (n = 10) and littermate controls (n = 8) on a regular chow diet at 30 °C. c, Oleic acid oxidation normalized to tissue mass (mg) in the interscapular BAT, inguinal WAT and gastrocnemius (Gast) muscle of mice on a regular chow diet. n = 4 per group. cpm, counts per minute. d, Immunoblot analysis of UCP1 and PRDM16 in the inguinal WAT and BAT of mice on an HFD. n = 3 per group. e, Regression-based analysis of energy expenditure against body mass. n = 7 per group. Data were analysed using CaIR-ANCOVA with energy expenditure as a dependent variable and body mass as a covariate. P values are shown at the bottom. f, Body weight of Adipo-Cul2-KO mice (n = 12) and littermate controls (n = 15) on an HFD at 22 °C. CLAMS, comprehensive laboratory animal monitoring system. g, Glucose-tolerance test of mice at 9 weeks of HFD. h, Insulin-tolerance test of mice at 10 weeks of HFD. i, Pyruvate-tolerance test of mice at 11 weeks of HFD. j, Triglyceride (TG) content in the liver of mice at 14 weeks of HFD. k, Serum cholesterol and triglyceride levels of the mice in j. For a and d, representative results from two independent experiments are shown. Gel source data are presented in Supplementary Fig. 1. For a–k, data are from biologically independent samples. For b, c and f–k, data are mean ± s.e.m. Two-sided P values were calculated using unpaired Student’s t-tests (b, c, j and k) or two-way repeated-measures ANOVA (f–h) followed by Fisher’s least significant difference test (f–i). *P < 0.05, **P < 0.01, ***P < 0.001. Exact P values are shown in Supplementary Table 2.

