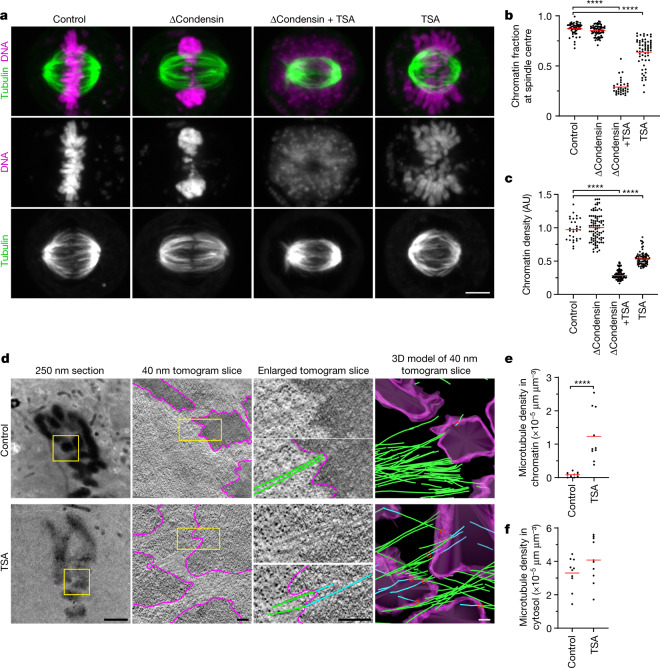
Fig. 1. Acetylation-regulated chromatin compaction prevents microtubule perforation in mitosis.
a, The contribution of condensin and histone deacetylases to mitotic chromosome compaction and congression to the spindle centre. HeLa cells with homozygously mAID-tagged SMC4 were treated with 5-PhIAA to deplete condensin (ΔCondensin) or with TSA to suppress mitotic histone deacetylation as indicated. Live-cell images with microtubules stained by SiR–tubulin; DNA was stained with Hoechst 33342. Projection of 5 z-sections. b, Quantification of chromosome congression by the fraction of chromatin localizing to the central spindle region. n = 51 (control), n = 65 (ΔCondensin), n = 34 (ΔCondensin + TSA), n = 61 (TSA) cells. The bars indicate the mean. Significance was tested using two-tailed Mann–Whitney U-tests (P < 10−15 (ΔCondensin + TSA); P < 10−15 (TSA); precision limit of floating-point arithmetic). c, Quantification of chromatin density in cells treated as described in a. n = 31 (control), n = 89 (ΔCondensin), n = 99 (ΔCondensin + TSA) and n = 74 (TSA) cells. The bars indicate the mean. Significance was tested using two-tailed Mann–Whitney U-tests (P < 10−15 (ΔCondensin + TSA); P < 10−15 (TSA); precision limit of floating-point arithmetic). AU, arbitrary units. d, Electron tomography analysis of wild-type prometaphase HeLa cells in the absence or presence of TSA. Magenta, chromatin surfaces; green, microtubules in cytoplasm; cyan, microtubules in chromatin. The red circles show the perforation sites. e,f, Quantification of microtubule density in chromatin (e) and cytoplasmic (f) regions as shown in d. n = 10 tomograms from 7 cells for each condition. The bars indicate the mean. Significance was tested using two-tailed Mann–Whitney U-tests (P = 1.083 × 10⁻⁵ (e); P = 0.247 (f)). Biological replicates: n = 2 (a–f). Scale bars, 5 µm (a), 2 µm (d, 250 nm section); 200 nm (tomogram slices and 3D model).

