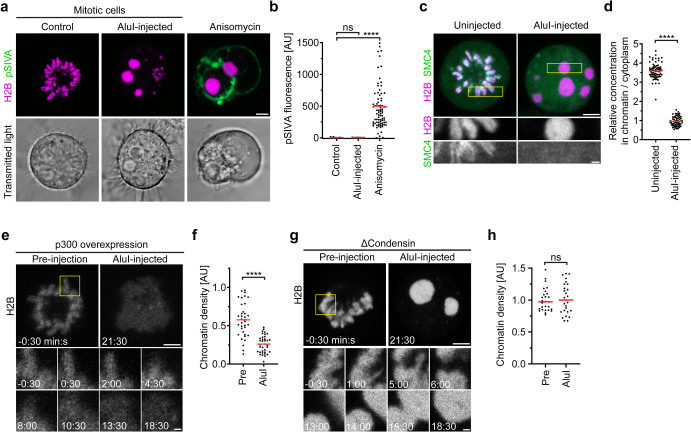
Extended Data Fig. 7. Analysis of AluI-fragmented chromosomes.
a,b, Measurement of early apoptosis marker pSIVA after AluI-injection. a, Hela cells expressing H2B-mCherry were treated with STLC and microinjected with AluI to induce chromatin fragmentation as in Fig. 2a, or treated with anisomycin to induce apoptosis as positive control. AluI-injected cells were imaged 1 h after injection. b, Quantification of pSIVA fluorescence on cell surface of untreated, AluI-injected, and anisomycin treated cells. n = 77 cells for control, n = 41 for AluI-injected, n = 83. Bars indicate mean, significance was tested by a two-tailed Mann-Whitney test (AluI-injected, P = 0.446; anisomycin, P<10−15, precision limit of floating-point arithmetic). c,d, Analysis of Smc4 localization after AluI-injection. c, Hela Smc4-HaloTAG cells expressing H2B-mCherry were stained with OregonGreen-488 HaloTAG ligand and mitotic cells were injected with AluI to fragment chromosomes. d, Quantification of Smc4-Halo fluorescence on chromatin relative to the cytoplasm of cells as in c. n = 75 uninjected cells, n = 60 AluI-injected cells. Bars indicate mean, significance was tested by a two-tailed Mann-Whitney test (P<10−15, precision limit of floating-point arithmetic). e,f, Chromatin fragmentation in cells overexpressing p300-HAT. e, AluI injection (t = 0 min) during time-lapse microscopy of cells expressing H2B-mCherry and expressing p300-HAT. f, Quantification of chromatin density in cells as in e, normalized to the mean of mock-transfected, non-injected cells. n = 12 cells, 3 ROIs per cell. Bar indicates mean, significance was tested by a two-tailed Mann-Whitney test (P = 2.075x10⁻¹⁰). g,h, AluI-fragmentation after condensin depletion. g. Smc4-AID HeLa cells expressing H2B-mCherry were treated 3 h with 5-PhIAA to deplete condensin and mitotic cells were then injected with AluI (t = 0 min) during time-lapse microscopy. h, Quantification of chromatin density before and after injection of AluI, normalized to the mean of untreated pre-injection cells. n = 7 cells, 3 ROIs each. Bars indicate mean, significance was tested by a two-tailed Mann-Whitney test (P = 0,887). Biological replicates: n = 3 (a,b,e,f); n = 2 (c,d); n = 5 (g,h). Scale bars, a,c,e,g 5 µm; insert c,e,g 1 µm.

