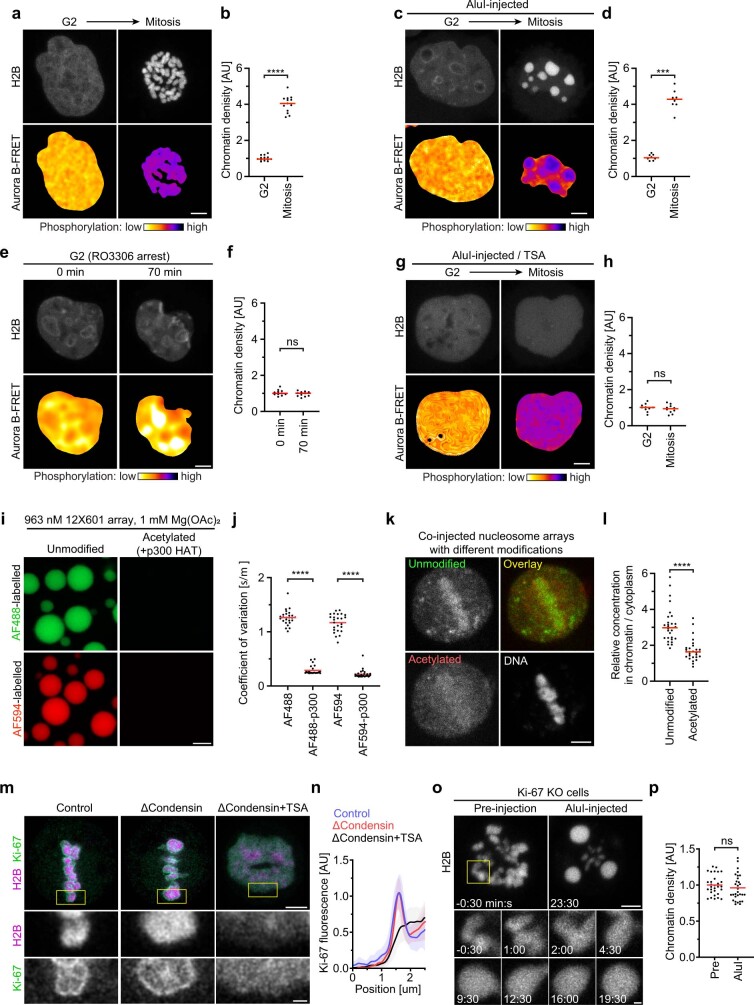
Extended Data Fig. 8. Analysis of chromatin phase transitions and role of Ki-67.
a, Chemical induction of G2-to-mitosis transition. HeLa cell expressing Aurora B-FRET biosensor was synchronized to G2 by RO3306 and then induced to enter mitosis by removing RO3306 and adding okadaic acid (OA). Mitotic entry was detected by chromosome compaction and FRET signal. Projection of 9 Z-sections. b, Quantification of chromatin density in G2 and mitosis as in a for n = 13 cells. Bars indicate mean; significance was tested by a two-tailed Mann-Whitney test (P = 1.923x10⁻⁷). c, Chromatin was fragmented in G2 cells by injection of AluI and mitosis subsequently induced as in a. Projection of 9 Z-sections. d, Quantification of chromatin density in G2 and mitosis as in c for n = 8 cells. Bars indicate mean; significance was tested by a two-tailed Mann-Whitney test (P = 1.554x10⁻⁴). e,f, Chromatin fragment localization in G2-arrested cells. e, HeLa cells expressing Aurora B-FRET biosensor were synchronized to G2 by RO3306 and microinjected in the nucleus with AluI. G2 state was retained in presence of RO3306 as indicated by FRET signal. t = 0 minutes refers to the first time point of the recorded time-lapse. f, Quantification of chromatin density in cells as in e, normalized to the mean of t = 0 min. n=11 cells. Bars indicate mean; significance tested by a two-tailed Mann-Whitney test (P = 0,438). g, Chromatin was fragmented in TSA-treated G2 cells by injection of AluI and mitosis was subsequently induced as in a. Projection of 9 Z-sections. h. Quantification of chromatin density in G2 and mitosis as in g for n=10 cells. Bars indicate mean; significance was tested by a two-tailed Mann-Whitney test (P = 0.481). i, j, In vitro liquid-liquid phase separation behaviour of unmodified or acetylated nucleosome arrays. i, 12X601 Nucleosome arrays labelled with fluorophores as indicated were treated with recombinant p300 histone acetyltransferase or no enzyme and then subjected to identical phase separation buffers for 30 min. j, Quantification of nucleosome array self-association into condensates by coefficient of variation (CV = σ/µ) in images as in i. n = 26 for AlexaFlour488 array (AF488), n = 25 for acetylated AlexaFluor488 array (AF488-p300), n = 25 for AlexaFluor594 array (AF594), n = 30 for acetylated AlexaFluor594 array (AF594-p300). Bars indicate mean; significance tested by a two-tailed Mann-Whitney test (AF488-Ac, P = 0.8x10⁻¹⁴; AF594-Ac, P<10−15, precision limit of floating-point arithmetic). k, Microinjection of synthetic nucleosome arrays that were either untreated or pre-incubated with p300 acetyltransferase into live mitotic cells, for n = 28 cells. Unmodified and acetylated nucleosome arrays were labelled by distinct fluorescent dyes. DNA was counterstained with DAPI. l, Quantification of unmodified and acetylated nucleosome array partitioning into mitotic chromatin. Bars indicate mean; significance was tested by a two-tailed Mann-Whitney test (P = 1.645x10⁻⁹). m,n, Ki-67 localization in mitotic cells after Smc4-degradation in the absence and presence of TSA. m, Cells expressing H2B-mCherry were transfected with a construct for expression of mNeonGreen-tagged Ki-67 and imaged without further perturbations (control) or treated with 5-PhIAA for 3 h to degrade Smc4 (ΔCondensin) or 5-PhIAA and TSA to additionally suppress mitotic histone deacetylation (ΔCondensin+TSA). Single Airyscan Z-section. n, Distribution of Ki-67 across the surface of mitotic chromatin in cells as in e. Line profiles were drawn perpendicularly across the chromatin/cytoplasm boundary in a single Airyscan Z-section. n = 5 cells for control, n = 7 for ΔCondensin, n = 8 for ΔCondensin+TSA. 2-3 line profiles per cell. Curves indicate mean +/− SD. o,p AluI chromatin fragmentation in Ki-67 knockout cells. o, Mitotic Ki-67 knockout HeLa cell expressing H2B-mCherry was injected with AluI (t = 0 min) during time-lapse microscopy. p, Quantification of chromatin density before and after injection of AluI, normalized to the mean of untreated pre-injection cells. n = 10 cells, 3 ROIs each. Bars indicate mean, significance was tested by a two-tailed Mann-Whitney test (P = 0,201). Biological replicates: n = 2 (a–l); n = 3 (m,n); n = 2 (o,p). Scale bars, 5 µm, inserts 1 µm.

