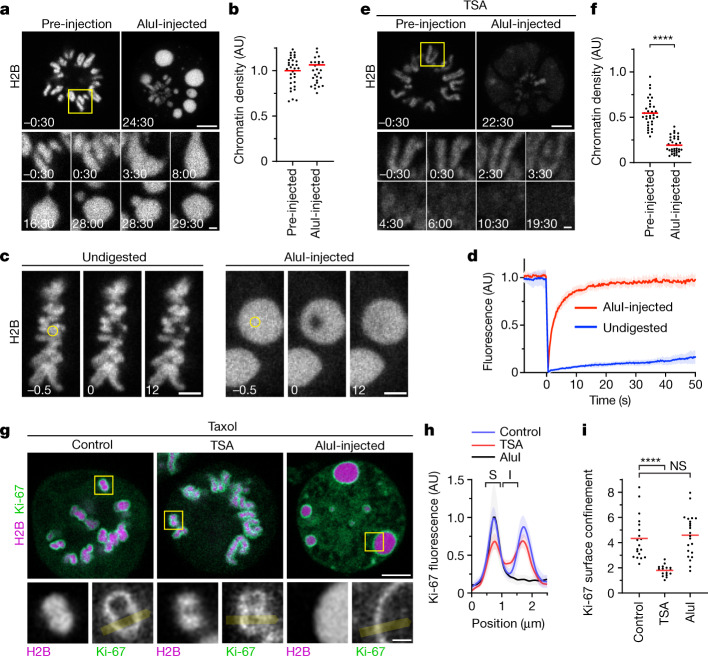
Fig. 2. Acetylation regulates chromatin solubility in mitotic cytoplasm.
a, Chromosome fragmentation in live mitotic HeLa cells by AluI injection (t = 0 min). Chromatin was visualized with H2B–mCherry. Projection of 3 z-sections. Time is shown as min:s. b, Quantification of chromatin density for cells as in a. n = 11 cells, 3 regions of interest (ROIs) each. The bars indicate the mean. Significance was tested using a two-tailed Mann–Whitney U-test (P = 0.332). c, Chromatin mobility in undigested metaphase chromosomes and after AluI injection, measured by fluorescence recovery after photobleaching in live metaphase cells expressing H2B–mCherry. The circles indicate the photobleaching region at t = 0 s. Time is shown as s. d, Quantification of fluorescence in n = 8 (undigested) or n = 10 (AluI-digested) cells as described in c. Data are mean ± s.d. e, AluI injection as described in a for a TSA-treated mitotic cell. Time is shown as min:s. f, Quantification of chromatin density, normalized to the mean of untreated pre-injection cells shown in b. n = 11 cells, 3 ROIs each. The bars indicate the mean. Significance was tested using a two-tailed Mann–Whitney U-test (P < 10−15; precision limit of floating-point arithmetic). g–i, Ki-67 localization in mitotic cells. g, HeLa cells expressing eGFP–Ki-67 and H2B–mCherry were treated with taxol for mitotic arrest (control); cells were treated with TSA or microinjected with AluI as indicated. Ki-67 localization was analysed in chromosomes oriented perpendicularly to the optical plane (insets). h, Line profiles across the chromatin–cytoplasm boundary as indicated by the yellow lines in g were aligned to the first peak in eGFP–Ki-67 fluorescence and normalized to the mean of Ki-67 fluorescence at the first peak of control. n = 19 (control), n = 24 (TSA) and n = 22 (AluI) cells. Data are mean ± s.d. i, Quantification of Ki-67 surface confinement by the ratio of Ki-67 fluorescence on the surface (S) over inside (I). n = 19 (control), n = 24 (TSA) and n = 22 (AluI) cells. The bars indicate the mean. Significance was tested using two-tailed Mann–Whitney U-tests (P = 9.305 × 10⁻¹⁰ (TSA); P = 0.476 (AluI)). Biological replicates: n = 3 (a,b,g–i); n = 2 (c–f). Scale bars, 5 µm (a, e and g, main images), 1 µm (a, e and g, insets) and 3 µm (c).

