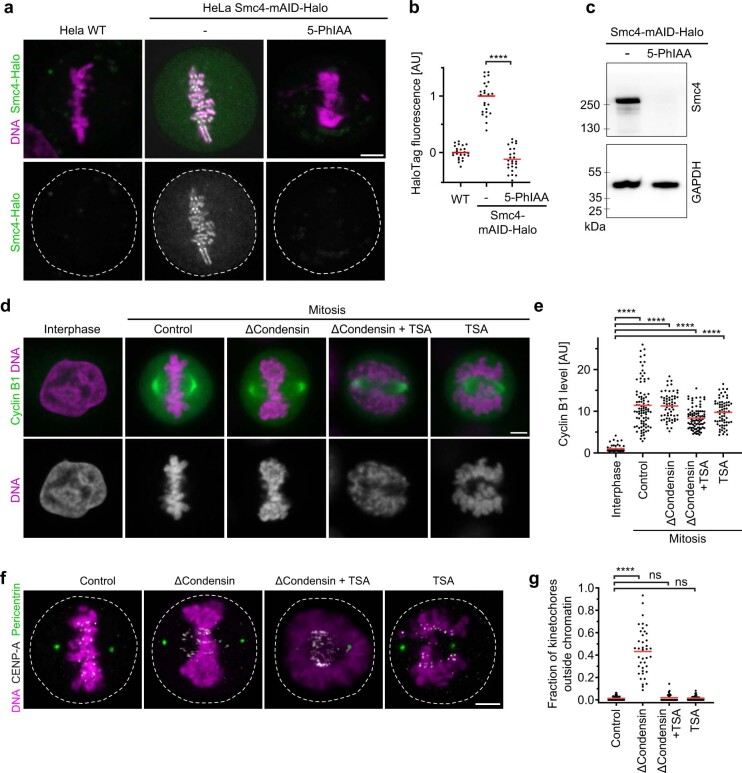
Extended Data Fig. 1. Characterization of HeLa Smc4-mAID-HaloTAG cells and analysis of mitotic phenotypes.
a-c, Smc4 expression analysis. a, HeLa cells with homozygous Smc4-mAID-Halo alleles and stably expressing OsTIR(F74G) were analysed with or without treatment of 5-Phenylindole-3-eacetic acid (5-PhIAA) for 3 h and stained with OregonGreen-488 HaloTAG ligand; HeLa wild-type (WT) cells serve as control to measure fluorescence background. DNA was stained with Hoechst 33342. Representative examples of HeLa WT (n = 25), HeLa Smc4-mAID-Halo (n = 25), HeLa Smc4-mAID-Halo + 5-PhIAA (n = 25). b, Quantification of HaloTAG fluorescence in live mitotic cells as shown in a. n = 25 for WT, n = 25 for Smc4-mAID-Halo without 5-PhIAA, n = 25 for Smc4-mAID-Halo with 5-PhIAA. Bars indicate mean; significance was tested by a two-tailed Mann-Whitney test (Smc4-mAID-Halo with 5-PhIAA, P = 1.4−14). c, Immunoblot analysis of Smc4-mAID-Halo cells with or without 3 h 5-PhIAA treatment. Representative examples of n = 2 experiments. For gel source data, see Supplementary Figure 1a. d, e, Analysis of cell cycle state by immunofluorescence staining against Cyclin B1. HeLa cells with homozygously mAID-tagged SMC4 were treated with 5-PhIAA to deplete condensin (ΔCondensin) or with TSA to suppress mitotic histone deacetylation as indicated. DNA was stained with Hoechst 33342. Classification of interphase and mitotic cell is based on overall cell shape and spindle morphology. e, Quantification of Cyclin B1 fluorescence in cells as in d. Data normalized to the mean of untreated interphase cells. n = 60 (interphase), n = 89 (mitotic), n = 59 (ΔCondensin), n = 83 (ΔCondensin+TSA), n = 67 (TSA) cells. Bars indicate mean; significance was tested by a two-tailed Mann-Whitney test (CTRL, P<10−15; ΔCondensin, P<10−15; ΔCondensin+TSA, P<10−15; TSA, P<10−15, precision limit of floating-point arithmetic). f, g, Immunofluorescence analysis of kinetochores and spindle poles in mitotic Smc4-mAID-Halo cells after 3 h degradation of Smc4 (ΔCondensin) and/or 3 h treatment with TSA as indicated. Projection of 7 Z-sections with Z-offset of 0.15 µm. g, Quantification of fraction of kinetochores outside chromatin regions (>0.5 µm distance from chromatin surface) of cells as in f. n = 40 cells for control n = 59 for ΔCondensin, n = 35 for ΔCondensin+TSA, n = 40 for TSA. Bars indicate mean, significance was tested by a two-tailed Mann-Whitney test (ΔCondensin, P<10−15, precision limit of floating-point arithmetic; ΔCondensin+TSA, P = 0.852; TSA, P = 0.911). Biological replicates: n = 2 (a–e); n = 3 (f,g). Scale bars, 5 µm.

