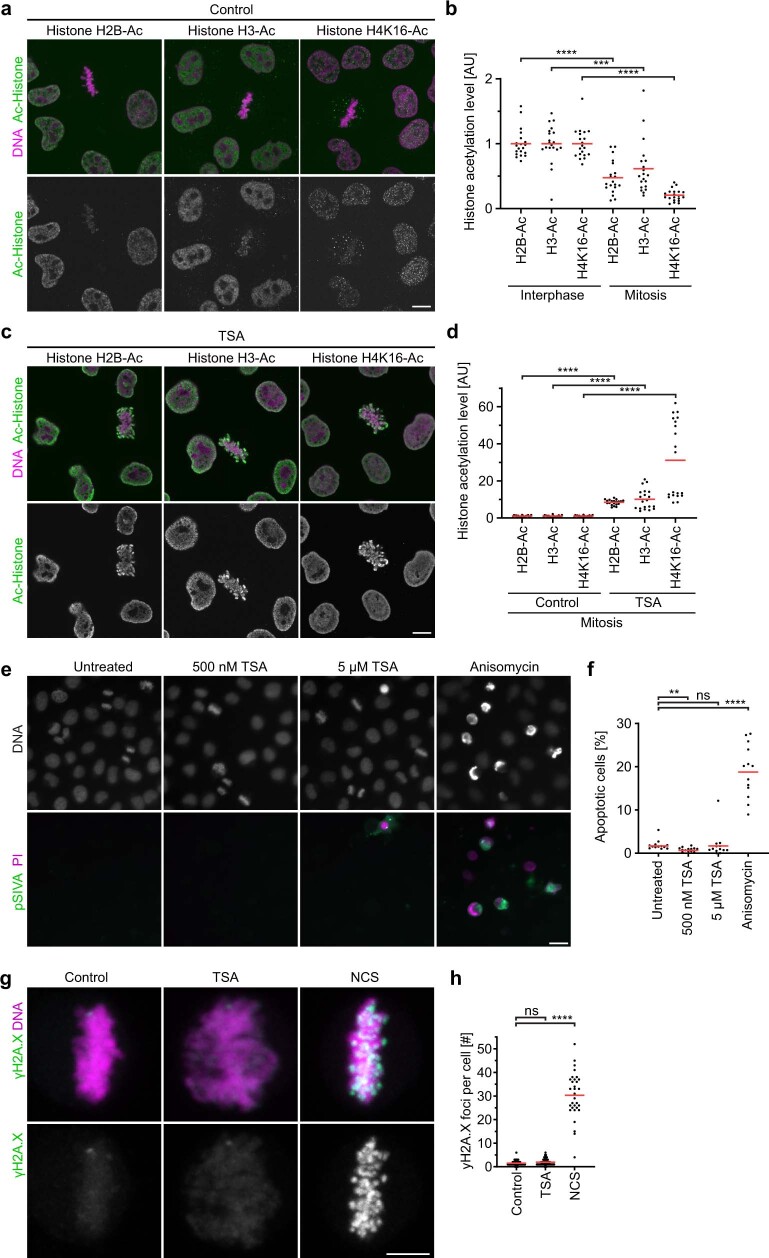
Extended Data Fig. 3. Histone acetylation during cell cycle progression and effect of TSA.
a,b, Immunofluorescence analysis of histone acetylation in interphase and mitosis. a, HeLa cells were fixed and stained with antibodies against different acetylated histones as indicated. b, Quantification of histone acetylation by immunofluorescence as in a, by the ratio of antibody fluorescence to DNA reference staining by Hoechst 33342. For each acetylated histone, all data points were normalized to the mean of interphase cells. n = 20 for H2B-Ac, Interphase, n = 20 for H3-Ac, Interphase, n = 20 for H4K16-Ac, Interphase, n = 20 for H2B-Ac, Mitosis, n = 20 for H3-Ac, Mitosis, n = 20 for H4K6-Ac, Mitosis. Bars indicate mean; significance was tested by a two-tailed Mann-Whitney test (H2B-Ac, P = 2.117x10⁻⁷; H3-Ac, Mitosis, P = 4.72x10⁻⁴; H4K16-Ac, P = 1.451x10⁻¹¹). c,d, Histone acetylation in mitotic cells after TSA treatment. c, HeLa cells were treated with TSA for 3 h, fixed, and histone acetylation analysed by immunofluorescence as in a. d, Quantification of histone acetylation as in b for mitotic cells 3 h after TSA treatment. For each antibody, all data points were normalized to the mean of control metaphase cells. n = 20 for H2B-Ac, control, n = 20 for H3-Ac, control, n = 20 for H4K16-Ac, control, n = 20 for H2B-Ac, TSA, n = 20 for H3-Ac, TSA, n = 20 for H4K16-Ac, TSA. Bars indicate mean; significance was tested by a two-tailed Mann-Whitney test (H2B-Ac, P = 1.451x10⁻¹¹; H3-Ac, P = 1.451x10⁻¹¹; H4K16-Ac, TSA, P = 1.451x10⁻¹¹). e,f, Analysis of apoptosis after TSA treatment. e, Fields of cells stained with Hoechst 33342, pSIVA, and PI to detect apoptotic cells were untreated (control) or treated for 3 h with 500 nM or 5 µM TSA, or 5 µM anisomycin as positive control. f, Quantification of apoptotic index after drug treatment of asynchronous cells, each dot representing a field of cells shown in e, with n = 4574 for untreated, n = 4926 for 500 nM TSA, n = 4653 for 5 µM TSA, and n = 4188 anisomycin cells in total. Bars indicate mean, significance was tested by a two-tailed Mann-Whitney test (500 nM TSA, P = 2.971x10⁻⁴; 5 µM TSA, P = 0.078; anisomycin, P = 1.923x10⁻⁷). g,h, Immunofluorescence analysis of yH2A.X DNA damage foci in mitosis after treatment with 5 µM TSA or the DNA-damaging agent neocarzinostatin (NCS) as positive control. g, Mitotic cells were stained for yH2A.X foci and DNA by Hoechst 33342 after indicated treatments. Z-projection of 11 Z-sections with Z-offset of 0.5 µm. h, Quantification of DNA-damage foci in cells as shown in g. n = 48 cells for control, n = 48 for TSA, n = 32 for NCS. Bars indicate mean, significance was tested by a two-tailed Mann-Whitney test (TSA, P = 0.103; NCS, P<10−15, precision limit of floating-point arithmetic). Biological replicates: n = 2 (a–d,g,h); n = 3 (e,f). Scale bars, a,c,e, 10 µm, g, 5 µm.

